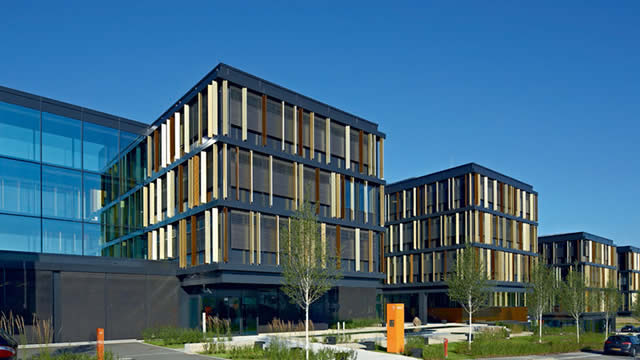
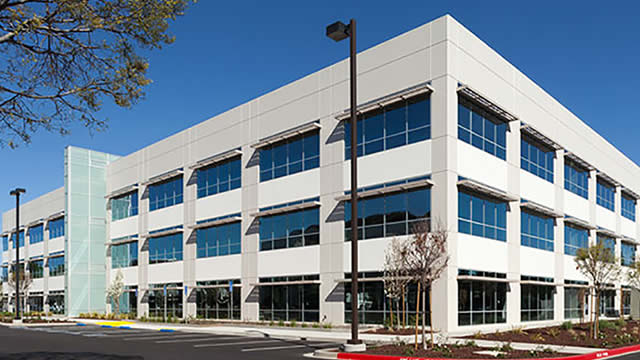
NETSTREIT is an internally managed Real Estate Investment Trust (REIT), headquartered in Dallas, Texas, specializing in the nationwide acquisition of single-tenant net ...
NETSTREIT Corp. is a publicly traded U.S. real estate investment trust listed on the New York Stock Exchange under the symbol NTST. Incorporated in Maryland in 2019 and headquartered at 2021 McKinney Avenue in Dallas, Texas, the company is internally managed and concentrates on single-tenant, net lease retail real estate. ...NETSTREIT Corp. is a publicly traded U.S. real estate investment trust listed on the New York Stock Exchange under the symbol NTST. Incorporated in Maryland in 2019 and headquartered at 2021 McKinney Avenue in Dallas, Texas, the company is internally managed and concentrates on single-tenant, net lease retail real estate. Its strategy is to acquire and own freestanding properties that are generally leased to established retailers and other consumer-facing businesses under long-term leases. In a net lease arrangement, tenants typically bear a significant portion of property-level costs, including taxes, insurance, maintenance, and repairs, allowing the landlord to receive comparatively predictable contractual rent with lower direct operating-cost exposure than in many conventional property models.
The company’s investment proposition is based on assembling a diversified portfolio of high-quality assets leased to financially sound tenants. NETSTREIT seeks properties with attractive locations, durable tenant demand, long lease durations, rent escalators, and limited exposure to businesses that are highly vulnerable to online substitution. Because the company owns real estate rather than manufacturing products, a traditional bill of materials, production cost structure, or research-and-development program is not applicable. Its principal costs include property acquisitions, financing expenses, interest on debt, general and administrative expenses, asset management costs, legal and professional fees, and capital expenditures related to maintaining or improving properties.
NETSTREIT is led by President and Chief Executive Officer Mark Manheimer, who has guided the company’s transformation into a net lease REIT. Other disclosed executives include Daniel Donlan, Chief Financial Officer and Treasurer, and Sofia Chernylo, Senior Vice President and Chief Accounting Officer. The company operates with a small corporate workforce; the supplied data reports 29 full-time employees, consistent with a specialized REIT model that relies on focused investment, asset-management, finance, and capital-markets expertise rather than a large operating workforce.
Financially, NETSTREIT’s revenue is primarily rental income from its property portfolio. The supplied trailing-twelve-month data reports approximately $2.0 billion in market capitalization, $3.4 billion in enterprise value, a dividend of approximately $0.87 per share, and a dividend yield of about 4.2 percent at the referenced market data point. The company uses debt and equity capital to fund property acquisitions and portfolio growth. Its future prospects depend on access to capital, acquisition discipline, tenant credit quality, occupancy, lease renewals, interest rates, property valuations, and the ability to maintain or grow recurring cash flows and shareholder distributions. As with other REITs, rising financing costs and changes in commercial real estate valuations can pressure results, while disciplined acquisitions and stable tenant performance can support long-term expansion.
YoYYoY means Year-over-Year. It compares the latest annual value with the previous annual value to show long-term trend strength.
QoQQoQ means Quarter-over-Quarter. It compares the latest quarter with the immediately previous quarter to show short-term momentum changes.
RevenueThe total money that came through the front door from selling things, before paying a single bill. Think of it as the grand total of every credit card swipe from customers. (YoY compares this year to last year's performance, while QoQ compares the current three months to the previous three).
$195.0M
+19.8%
+13.8%
Net IncomeThe absolute bottom line. If the company paid every single supplier, employee, banker, and tax collector, this is the actual money left in their pocket at the end of the day.
$6.9M
+157.8%
+10.5%
Gross MarginThe basic markup. If they sell a $100 pair of sneakers, this percentage tells you how much of that price tag is profit right after paying for the rubber and shoelaces, but before paying for things like store rent or TV commercials.
+90.0%
+1.1%
+0.5%
Operating MarginThe 'day job' efficiency score. Out of every dollar a customer spends, this shows how many cents the company keeps after making the product AND paying for all the everyday corporate overhead (like salaries, marketing, and keeping the lights on).
+34.6%
+16.4%
-5.9%
Net MarginThe final take-home percentage. When you strip away every conceivable cost, tax, and interest payment, this is the exact number of cents the company truly gets to keep from every dollar in sales.
+3.5%
+148.3%
-2.9%
Free Cash FlowThe holy grail of corporate cash. It's the spendable, physical money left over after the business pays for its daily operations AND buys the big, expensive upgrades (like new factories or servers) it needs to survive. This is the 'free' money they can use to pay dividends or buy back stock.
$109.5M
+21.4%
+3.6%
FCF MarginThe ultimate cash conversion rate. It shows how good the company is at turning regular sales directly into cold, hard, spendable cash. A high percentage means the business is an absolute cash-printing machine.
+56.1%
+1.3%
+15.3%
Debt / EquityThe financial risk gauge. It compares how much of the company's empire was built using borrowed money (loans) versus the owners' own money (shareholders). A high number means they are heavily leveraged and playing a riskier game; a low number means they are playing it safe.
77.6%
+15.5%
+9.6%
Current RatioThe 12-month survival check. It simply compares the cash they have right now (plus things they can quickly turn into cash) against the immediate bills they absolutely must pay this year. A score above 1 means they have enough in the wallet to cover the upcoming bills without panicking.
7.06x
+707.6%
-8.2%
Total AssetsThe absolute size of the company's empire. It bundles together absolutely everything of value they own—from the cash in the register and the inventory in the warehouse, to the software patents in the vault and the factories on the ground.
Operator: Greetings, and welcome to the NETSTREIT Second Quarter 26 Earnings Call. At this time, all participants are in a listen-only mode. As a reminder, this conference is being recorded. It is now my pleasure to introduce Matt Miller, Capital Markets Investor Relations. Thank you. You may begin.
Matt Miller: Good morning, and thank you for joining us for NETSTREIT's second quarter 26 Earnings Conference Call. On today's call, management's remarks and responses to your questions may contain statements considered forward looking under federal securities law. These statements address matters subject to risks and uncertainties that may cause actual results to differ from those discussed today. For more information on these factors, we encourage you to review our latest Form 10-Ks and other SEC filings. All forward looking statements are made as of today's date, and NETSTREIT assumes no obligation to them in the future. In addition, certain financial information presented on the call includes non GAAP financial measures. Please refer to our earnings release and supplemental package for definitions, reconciliations to the most comparable GAAP measures and an explanation of their usefulness to investors. These materials can be found in the Investor Relations section of the company's website at netstreet.com. Today's call is hosted by NETSTREIT CEO, Mark Manheimer, and CFO, Daniel Donlan. They will make some prepared remarks followed by a Q&A session. With that, I will turn the call over to Mark.
Mark Manheimer: Thank you, Matt, and good morning, everyone. We appreciate you joining us today to discuss NETSTREIT's second quarter 26 results. I want to begin by thanking our entire team for their outstanding execution and dedication. We have now grown the portfolio to over $3 billion in assets, and we continue to see an elevated number of high quality opportunities at accretive pricing. Which should provide for an increasingly attractive growth backdrop as we head into 2027 and beyond. In the second quarter, we saw continued acceleration on the investment front. We closed $299 million of gross investments driven by well priced assets in our core necessity and service based sectors. Including quick service restaurants, grocery, convenience store, auto service, and other essential retail categories. These investments were completed at a blended cash yield of 7.4% with a weighted average lease term of 9.8 years. As a complement to this, we executed targeted dispositions at a 6.8% blended cash yield, the proceeds of which were recycled into higher quality, longer duration opportunities that enhanced our portfolio quality and further reduced select tenant and industry concentrations. This robust start to the year reflects the depth of our sourcing platform and our team's ability to move quickly across a wide swath of opportunities while still staying disciplined in our underwriting criteria. With that in mind, we have seen an uptick in portfolio transactions …