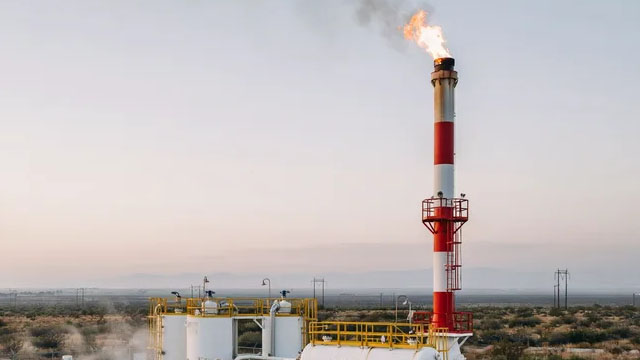
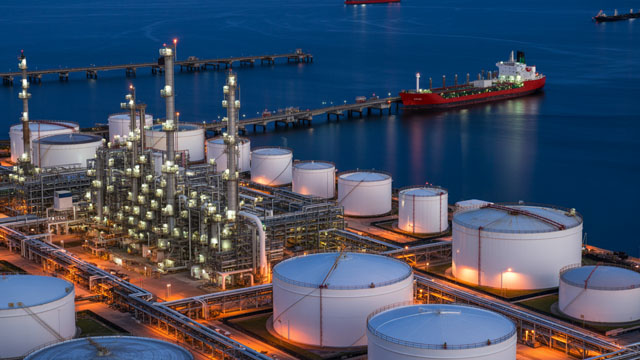
MPLX LP, formed in 2012 by Marathon Petroleum Corporation and headquartered in Findlay, Ohio, is a master limited partnership that operates in two primary segments: Logistics and Storage, and Gathering and Processing. The company manages extensive midstream assets including pipelines, storage terminals, and marine vessels, providing essential services for the ...MPLX LP, formed in 2012 by Marathon Petroleum Corporation and headquartered in Findlay, Ohio, is a master limited partnership that operates in two primary segments: Logistics and Storage, and Gathering and Processing. The company manages extensive midstream assets including pipelines, storage terminals, and marine vessels, providing essential services for the energy industry. Its operations encompass the gathering, processing, and transportation of natural gas; the handling of natural gas liquids; and the collection and distribution of crude oil and refined products. MPLX also operates inland marine businesses, fuel distribution services, and specialized terminal facilities. Financially, MPLX has a market cap of about $60 billion and generates strong cash flows, with an enterprise value of $84.9 billion. The company is led by Chairman, President, and CEO Maryann T. Mannen, and employs over 5,700 people. MPLX has a history of returning value to unitholders through distributions, recently increasing its quarterly distribution by 12.5%. The company benefits from its strategic relationship with Marathon Petroleum and continues to expand its infrastructure to support the growing demand for energy logistics.
YoYYoY means Year-over-Year. It compares the latest annual value with the previous annual value to show long-term trend strength.
QoQQoQ means Quarter-over-Quarter. It compares the latest quarter with the immediately previous quarter to show short-term momentum changes.
RevenueThe total money that came through the front door from selling things, before paying a single bill. Think of it as the grand total of every credit card swipe from customers. (YoY compares this year to last year's performance, while QoQ compares the current three months to the previous three).
$11.8B
+8.4%
+15.7%
Net IncomeThe absolute bottom line. If the company paid every single supplier, employee, banker, and tax collector, this is the actual money left in their pocket at the end of the day.
$4.9B
+13.8%
+19.2%
Gross MarginThe basic markup. If they sell a $100 pair of sneakers, this percentage tells you how much of that price tag is profit right after paying for the rubber and shoelaces, but before paying for things like store rent or TV commercials.
+45.2%
+2.4%
+38.8%
Operating MarginThe 'day job' efficiency score. Out of every dollar a customer spends, this shows how many cents the company keeps after making the product AND paying for all the everyday corporate overhead (like salaries, marketing, and keeping the lights on).
+40.3%
-16.9%
+16.3%
Net MarginThe final take-home percentage. When you strip away every conceivable cost, tax, and interest payment, this is the exact number of cents the company truly gets to keep from every dollar in sales.
+41.6%
+5.0%
+3.0%
Free Cash FlowThe holy grail of corporate cash. It's the spendable, physical money left over after the business pays for its daily operations AND buys the big, expensive upgrades (like new factories or servers) it needs to survive. This is the 'free' money they can use to pay dividends or buy back stock.
$4.1B
-16.1%
+13.6%
FCF MarginThe ultimate cash conversion rate. It shows how good the company is at turning regular sales directly into cold, hard, spendable cash. A high percentage means the business is an absolute cash-printing machine.
+34.7%
-22.6%
-1.8%
Debt / EquityThe financial risk gauge. It compares how much of the company's empire was built using borrowed money (loans) versus the owners' own money (shareholders). A high number means they are heavily leveraged and playing a riskier game; a low number means they are playing it safe.
182.9%
+17.6%
-0.6%
Current RatioThe 12-month survival check. It simply compares the cash they have right now (plus things they can quickly turn into cash) against the immediate bills they absolutely must pay this year. A score above 1 means they have enough in the wallet to cover the upcoming bills without panicking.
1.23x
+21.4%
-19.2%
Total AssetsThe absolute size of the company's empire. It bundles together absolutely everything of value they own—from the cash in the register and the inventory in the warehouse, to the software patents in the vault and the factories on the ground.
Operator: Welcome to the MPLX Second Quarter 2026 Earnings Call. My name is Julie, and I will be your operator for today's call.[Operator Instructions] Please note that this conference is being recorded. I will now turn the call over to [ Brian Worthington ]. Brian, you may begin.
Unknown Executive: Welcome to MPLX's Second Quarter 2026 Earnings Conference Call. The slides that accompany this call can be found on our website at mplx.com under the Investors tab. Joining me on the call today are Maryann Mannen, President and CEO; Kris Hagedorn, CFO; and other members of the executive team. We invite you to read the safe harbor statements on Slide 2. We will be making forward-looking statements today. Actual results may differ. Factors that could cause actual results to differ are included there as well as in our filings with the SEC. With that, I will turn the call over to Maryann.
Maryann Mannen: Thanks, Brian. Good morning, and thank you for joining our call. Our second quarter results reflect the consistent execution of our strategic priorities. MPLX delivered $1.8 billion of adjusted EBITDA in the second quarter, a 5% increase versus the same period last year, more than overcoming the divestiture of the Rockies assets in late 2025. This enabled a return of over $1.1 billion to our unitholders. 2026 is also a year of execution. We continue to advance high-return projects across our integrated natural gas and NGL value chains. The sequencing of projects entering service gives us confidence in a meaningful increase in EBITDA in the second half of 2026 and next year. In the Delaware Basin, we placed the Secretariat I processing plant into service in April, and exited the quarter at 86% utilization of our Delaware Basin processing system, demonstrating strong producer demand and operational excellence from our teams. And in August, the Harmon Creek III processing plant is beginning operations in line with our strategy to add processing capacity on a just-in-time basis. This increases our total processing capacity to 8.1 billion cubic feet per day and deethanization capacity to over 800,000 barrels per day. This plant, along with our associated gathering and compression expansions, extends our ability to meet producer needs in liquids-rich areas and supports long-term throughput growth. As we expand MPLX's core value chains, we are also focused on maximizing utilization of existing assets and optimizing operations. In the Northeast, Marcellus processing utilization of 96% in the quarter led to record volumes across our system, while strong production activity in the Utica supported processing utilization of 73%. In the Permian, sour gas treating volumes exceeded 150 million cubic feet per day for the second consecutive quarter as we continue to optimize operations at our Titan treating facility. As throughputs increase across our gathering and processing assets and additional projects enter service in the second half of the year, MPLX remains …