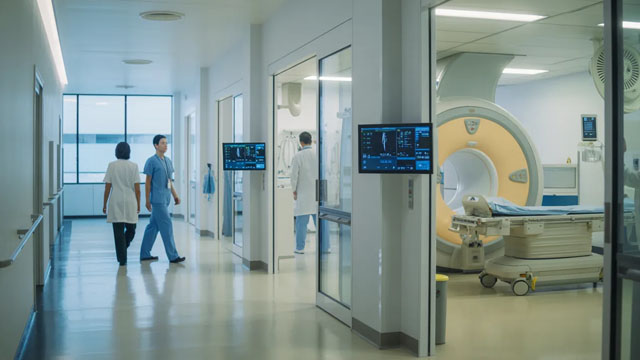
Lumexa Imaging Holdings, Inc. manages and operates diagnostic imaging centers throughout the United States. These facilities deliver a comprehensive range of outpatient ...
Lumexa Imaging Holdings, Inc. (LMRI) is a prominent healthcare services provider, specifically specializing in the management and operation of outpatient diagnostic imaging facilities. Founded in 2018 and headquartered in Raleigh, North Carolina, the company has scaled its operations to manage a broad footprint of centers throughout the United States. Its ...Lumexa Imaging Holdings, Inc. (LMRI) is a prominent healthcare services provider, specifically specializing in the management and operation of outpatient diagnostic imaging facilities. Founded in 2018 and headquartered in Raleigh, North Carolina, the company has scaled its operations to manage a broad footprint of centers throughout the United States. Its core service portfolio includes high-acuity diagnostic technology such as Magnetic Resonance Imaging (MRI), Computed Tomography (CT), and Positron Emission Tomography (PET) scans, alongside routine diagnostic services like X-rays, mammography, and ultrasound.
From a business perspective, Lumexa positions itself as a critical link in the healthcare delivery continuum, assisting referring physicians with high-quality, efficient imaging diagnostics to facilitate faster patient treatment cycles. Operationally, the company employs over 4,000 full-time staff to manage these clinical workflows. Financial performance indicates a company in a capital-intensive phase; as of recent reporting, the company maintains a market capitalization of approximately $1.04 billion. The firm is currently navigating a period of financial stabilization following its December 2025 IPO. With a total enterprise value of roughly $1.95 billion, the company is heavily focused on leveraging its infrastructure to drive scale, despite challenges represented by a negative net profit margin of 5.2% and a significant reliance on debt financing (debt-to-equity ratio of 1.613).
Key leadership, led by CEO Caitlin Zulla, is tasked with optimizing the company's cost structure—notably managing its high volume of intangible assets and addressing the cash conversion cycle of approximately 79 days. The company does not currently focus on R&D for manufacturing, as it is a pure-play service provider; thus, its cost structure is heavily weighted toward labor and facility maintenance rather than hardware development. Future growth strategy appears focused on expanding geographical coverage and improving operating margins, which currently hover near breakeven levels. The company's focus remains on patient accessibility and high-throughput diagnostic capability, serving as a consolidation play in a fragmented diagnostic imaging sector.
YoYYoY means Year-over-Year. It compares the latest annual value with the previous annual value to show long-term trend strength.
QoQQoQ means Quarter-over-Quarter. It compares the latest quarter with the immediately previous quarter to show short-term momentum changes.
RevenueThe total money that came through the front door from selling things, before paying a single bill. Think of it as the grand total of every credit card swipe from customers. (YoY compares this year to last year's performance, while QoQ compares the current three months to the previous three).
$1.0B
+7.8%
+4.6%
Net IncomeThe absolute bottom line. If the company paid every single supplier, employee, banker, and tax collector, this is the actual money left in their pocket at the end of the day.
$-47.1M
+49.9%
+59.9%
Gross MarginThe basic markup. If they sell a $100 pair of sneakers, this percentage tells you how much of that price tag is profit right after paying for the rubber and shoelaces, but before paying for things like store rent or TV commercials.
+11.5%
+12.9%
+10.7%
Operating MarginThe 'day job' efficiency score. Out of every dollar a customer spends, this shows how many cents the company keeps after making the product AND paying for all the everyday corporate overhead (like salaries, marketing, and keeping the lights on).
+2.6%
-55.1%
-7.1%
Net MarginThe final take-home percentage. When you strip away every conceivable cost, tax, and interest payment, this is the exact number of cents the company truly gets to keep from every dollar in sales.
-4.6%
+53.6%
+52.8%
Free Cash FlowThe holy grail of corporate cash. It's the spendable, physical money left over after the business pays for its daily operations AND buys the big, expensive upgrades (like new factories or servers) it needs to survive. This is the 'free' money they can use to pay dividends or buy back stock.
$-6.4M
-149.4%
+1071.0%
FCF MarginThe ultimate cash conversion rate. It shows how good the company is at turning regular sales directly into cold, hard, spendable cash. A high percentage means the business is an absolute cash-printing machine.
-0.6%
-145.8%
+1028.3%
Debt / EquityThe financial risk gauge. It compares how much of the company's empire was built using borrowed money (loans) versus the owners' own money (shareholders). A high number means they are heavily leveraged and playing a riskier game; a low number means they are playing it safe.
164.2%
-79.7%
-1.7%
Current RatioThe 12-month survival check. It simply compares the cash they have right now (plus things they can quickly turn into cash) against the immediate bills they absolutely must pay this year. A score above 1 means they have enough in the wallet to cover the upcoming bills without panicking.
1.27x
+27.7%
+2.3%
Total AssetsThe absolute size of the company's empire. It bundles together absolutely everything of value they own—from the cash in the register and the inventory in the warehouse, to the software patents in the vault and the factories on the ground.
Operator: Thank you for standing by, and welcome to the Lumexa Imaging Second Quarter 2026 Earnings Conference Call. [Operator Instructions] As a reminder, today's program is being recorded. And now I'd like to introduce your host for today's program, Sue Dooley, Investor Relations. Please go ahead, ma'am.
Sue Dooley: Thank you, and hello, everyone. We appreciate you joining us today. Leading today's call are our Chief Executive Officer, Caitlin Zulla; and Tony Martin, our Chief Financial Officer. Before we begin, I want to note that today's discussion will include forward-looking statements, including statements regarding our 2026 guidance, expected operating performance, growth initiatives, reimbursement assumptions, capital expenditures and other future events. These statements reflect our current expectations and assumptions, which are subject to risks and uncertainties that could cause actual results to differ materially. Please refer to the forward-looking statements and risk factors described in today's earnings release and our most recent SEC filings for additional information. We undertake no obligation to update these statements. We will also discuss certain non-GAAP financial measures. Definitions and reconciliations to the most directly comparable GAAP measures are included in today's earnings release. With that, I will now turn the call over to Caitlin. Caitlin, please go ahead.
Caitlin Zulla: Thanks, Sue. Thank you all for joining us today. Q2 was a quarter of substantial progress as we continue to execute against the strategic priorities, which support our ambition to build the premier platform for high-quality, lower-cost outpatient imaging serving health systems, physicians and patients. These include driving strong same-center growth with an expanding mix of advanced modalities, new de novo openings and ensuring the successful ramp of new centers, accelerating high-impact strategic service lines and expanding our geographic footprint through disciplined, capital-efficient growth. I'm eager to share our progress tonight. A few highlights from the quarter. In Q2, we demonstrated continued strength of our core business. We delivered healthy growth in total same-center volumes, sustained momentum in advanced modalities, continued maturation of our de novo cohorts and important progress in expanding our health system partnerships. Advanced modalities grew to 37.4% of total volume, a record high for our company and 111 basis points higher than a year ago. Our advanced modality mix shift continues to build, driving higher reimbursement and margin for the business. In May, we announced 4 new centers. So far this year, we've opened 2 de novos against our ongoing goal of 8 to 10 annually. We also completed 2 acquisitions, including our first site with the UPMC joint venture. And as we've previously indicated, the balance of this year's openings will be later in the year, and we remain on track to hit our full year de novo target. In …