Imperial Petroleum Inc. operates globally, offering maritime shipping solutions to a diverse clientele, including petroleum producers, refiners, and commodity traders. The company's ...
Imperial Petroleum Inc. (IMPP) is an international shipping transportation company focused on the maritime transport of petroleum and petrochemical products, as well as crude oil and other energy-related cargoes. Headquartered in Athens, Greece, the company was incorporated in 2021 (under the laws of the Marshall Islands) and has been led ...Imperial Petroleum Inc. (IMPP) is an international shipping transportation company focused on the maritime transport of petroleum and petrochemical products, as well as crude oil and other energy-related cargoes. Headquartered in Athens, Greece, the company was incorporated in 2021 (under the laws of the Marshall Islands) and has been led by founder and CEO Harry N. Vafias since the company’s inception.
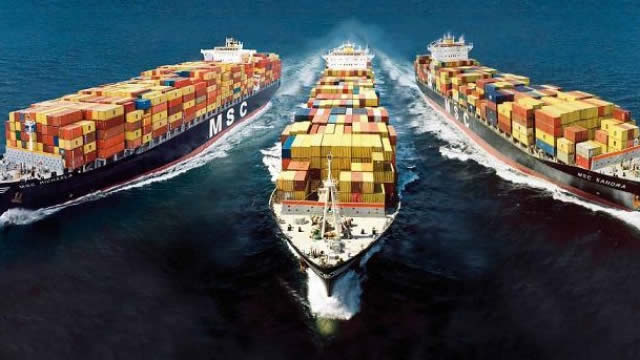
From a business and operating perspective, Imperial Petroleum’s core service is the chartering/operation of tanker vessels that move refined petroleum products (such as gasoline, diesel, jet fuel, and fuel oil) and crude oils for a range of customers. These customers typically include petroleum producers, refiners, and commodity traders who need reliable sea transport for supply-chain logistics, inventory positioning, and market access. The company’s fleet includes vessels specialized by cargo type—for example, medium-range tankers for refined petroleum products and at least one vessel dedicated to crude oil transport—enabling it to participate in shipping demand shaped by global trade flows and commodity movements.
In product/service terms, IMPP’s offerings are essentially transportation capacity and shipping execution: owning and operating tankers, managing vessel availability, complying with maritime and safety/regulatory requirements, and contracting shipping capacity via charters. The company’s shipping revenues are therefore influenced by freight rates, utilization, contract duration mix, and operating efficiency. At the cost/BOM level for a ship-owning operator, major cost drivers generally include vessel operating expenses (crew, maintenance/repairs, insurance, supplies), chartering/management costs, and capital expenditures for vessel upgrades and sustaining capital. The provided financial-style metrics (e.g., liquidity and profitability ratios) suggest the business can generate meaningful operating profit margins, with valuation indicators (e.g., low price-to-book) that often reflect capital intensity and balance-sheet structure typical for shipping.
Financially, IMPP is publicly traded on the NASDAQ Capital Market. The company’s performance is also subject to cyclicality in the tanker shipping market and to factors such as interest rates and vessel utilization. The company’s reported enterprise value and margins (as reflected in the provided snapshot-style metrics) indicate an operating profile that can translate revenue into profitability, while free cash flow dynamics can be affected by capex timing and working-capital movements. Shipping operators also depend on prudent financial leverage and liquidity management to handle voyage timing, receivables, and cash flow variability.
Key people include CEO/President Harry N. Vafias, who has served since inception. Overall, Imperial Petroleum’s strategic “wish” in such a business model is typically to maintain vessel quality, maximize utilization, secure favorable charter coverage, and manage capital allocation to grow/renew fleet capacity while controlling costs and balance-sheet risk.
Note: Fleet composition and capacity details can change over time due to vessel additions, disposals, and contract commitments; the business description provided indicates a small-to-midsize tanker fleet supporting both refined-products and crude-oil transport.
EPS estimate unavailable · Fiscal period ending 2026-06-30
Today
5Y Trend (Revenue, Earnings, FCF)
Metric
Latest
YoYYoY means Year-over-Year. It compares the latest annual value with the previous annual value to show long-term trend strength.
QoQQoQ means Quarter-over-Quarter. It compares the latest quarter with the immediately previous quarter to show short-term momentum changes.
RevenueThe total money that came through the front door from selling things, before paying a single bill. Think of it as the grand total of every credit card swipe from customers. (YoY compares this year to last year's performance, while QoQ compares the current three months to the previous three).
$161.0M
+9.2%
+20.7%
Net IncomeThe absolute bottom line. If the company paid every single supplier, employee, banker, and tax collector, this is the actual money left in their pocket at the end of the day.
$50.0M
-0.4%
+87.3%
Gross MarginThe basic markup. If they sell a $100 pair of sneakers, this percentage tells you how much of that price tag is profit right after paying for the rubber and shoelaces, but before paying for things like store rent or TV commercials.
+28.7%
-16.0%
+50.9%
Operating MarginThe 'day job' efficiency score. Out of every dollar a customer spends, this shows how many cents the company keeps after making the product AND paying for all the everyday corporate overhead (like salaries, marketing, and keeping the lights on).
+24.8%
-17.2%
+60.9%
Net MarginThe final take-home percentage. When you strip away every conceivable cost, tax, and interest payment, this is the exact number of cents the company truly gets to keep from every dollar in sales.
+31.0%
-8.7%
+55.2%
Free Cash FlowThe holy grail of corporate cash. It's the spendable, physical money left over after the business pays for its daily operations AND buys the big, expensive upgrades (like new factories or servers) it needs to survive. This is the 'free' money they can use to pay dividends or buy back stock.
$79.1M
+2515.6%
+53.8%
FCF MarginThe ultimate cash conversion rate. It shows how good the company is at turning regular sales directly into cold, hard, spendable cash. A high percentage means the business is an absolute cash-printing machine.
+49.1%
+2295.9%
+27.5%
Debt / EquityThe financial risk gauge. It compares how much of the company's empire was built using borrowed money (loans) versus the owners' own money (shareholders). A high number means they are heavily leveraged and playing a riskier game; a low number means they are playing it safe.
0.0%
-100.0%
—
Current RatioThe 12-month survival check. It simply compares the cash they have right now (plus things they can quickly turn into cash) against the immediate bills they absolutely must pay this year. A score above 1 means they have enough in the wallet to cover the upcoming bills without panicking.
11.99x
+51.4%
-51.9%
Total AssetsThe absolute size of the company's empire. It bundles together absolutely everything of value they own—from the cash in the register and the inventory in the warehouse, to the software patents in the vault and the factories on the ground.
Operator: Good day, and thank you for standing by. Welcome to the Q1 2026 Imperial Petroleum Results Conference Call. [Operator Instructions] Please be advised that this conference is being recorded. I would now like to hand the conference over to your speaker today, Imperial Petroleum CEO, Mr. Harry Vafias. Please go ahead.
Harry Vafias: Good morning, everyone, and thank you all for joining us for our first quarter '26 conference call of Imperial Petroleum. I'm Harry Vafias, the CEO of Imperial Petroleum. And joining me on the call today is Ms. Sakellari, who will be discussing our financial performance. Before we commence our discussion, we'd like all to read the safe harbor disclaimer on Slide 2. In essence, it's made clear that this presentation may contain some forward-looking statements as defined by the Private Securities Litigation Act. We raise the attention of our investors the fact that such forward-looking statements are based upon the current beliefs and expectations of Imperial Petroleum and are subject to risks and uncertainties which could cause future results to differ materially from these forward-looking statements. In addition, we'd like to clarify that during this call, we will quote monetary amounts, unless explicitly stated otherwise, all in U.S. dollars. In Slide 3, we summarize our key operational and financial highlights for Q1 '26. The year '26 commenced in an extremely favorable way for Imperial Petroleum. Our enhanced fleet of tankers and drybulk ships fully capitalized upon the firm rates prevailing throughout the period. This quarter, with revenues of $61.7 million and a net income of $28 million, we marked our second best quarterly performance in our history. We view our results as a solid proof that our strategic decision to expand our fleet was sound as a larger fleet allows us to leverage favorable market conditions and generate material results. The tension in the Middle East, which commenced close to the end of February '26, brought upon a global turbulence and heavily affected seaborne trade. The closing of the Strait of Hormuz tightened the tanker market, causing tanker rates to boom. It's worth to mention that our daily net revenue from tankers dramatically increased in Q1 '26 to about $43,000 a day, compared to $27,000 a day in Q4 '25. Drybulk market also remained firm. Our daily net revenue from our drybulk ships increased in Q1 '26 to about $16,000. Looking briefly at our operational highlights. Our fleet operational utilization came in at 88.7%, a bit lower than in Q4 '25 due to increased ballasting activity of our vessels traveling to their next employment. Looking at our fleet subsegments, operational utilization for Q1 '26 was 87.8% for our tankers and 89.5% for dry vessels. About 59% of the total fleet calendar days in Q1 '26 were dedicated to time charter activity, while the remaining approximately 40% is spot activity. Following the delivery of our drybulk vessel, the Post Marvel, in the …