Granite Construction Incorporated is a leading U.S. company that functions as both an infrastructure contractor and a producer of essential construction materials. ...
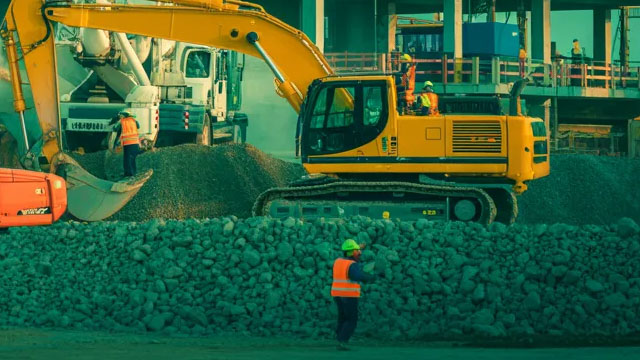
Granite Construction Incorporated, founded in 1922, is a diversified infrastructure company headquartered in Watsonville, California. The company operates through two primary segments: Construction and Materials. The Construction segment focuses on public infrastructure projects such as highways, bridges, rail systems, airports, marine facilities, dams, reservoirs, and water distribution systems. It also ...Granite Construction Incorporated, founded in 1922, is a diversified infrastructure company headquartered in Watsonville, California. The company operates through two primary segments: Construction and Materials. The Construction segment focuses on public infrastructure projects such as highways, bridges, rail systems, airports, marine facilities, dams, reservoirs, and water distribution systems. It also undertakes complex ventures like tunnels, mining operations, and solar energy projects. The Materials segment produces aggregates and asphalt, supplying these materials to both internal projects and external customers, including contractors, landscapers, and manufacturers. Granite serves a wide range of clients, from federal and local government agencies to private developers and homeowners. With over 6,400 employees, the company is recognized for its safety record and sustainability practices. Financially, Granite has a market cap of approximately $5.6 billion, with revenue around $4.4 billion. Key executives include CEO Kyle Larkin and CFO Staci Woolsey. The company emphasizes innovation, quality, and long-term infrastructure development, aiming to be a full-suite provider in transportation, water infrastructure, and mineral exploration markets.
YoYYoY means Year-over-Year. It compares the latest annual value with the previous annual value to show long-term trend strength.
QoQQoQ means Quarter-over-Quarter. It compares the latest quarter with the immediately previous quarter to show short-term momentum changes.
RevenueThe total money that came through the front door from selling things, before paying a single bill. Think of it as the grand total of every credit card swipe from customers. (YoY compares this year to last year's performance, while QoQ compares the current three months to the previous three).
$4.4B
+10.4%
+59.6%
Net IncomeThe absolute bottom line. If the company paid every single supplier, employee, banker, and tax collector, this is the actual money left in their pocket at the end of the day.
$193.0M
+52.8%
-567.1%
Gross MarginThe basic markup. If they sell a $100 pair of sneakers, this percentage tells you how much of that price tag is profit right after paying for the rubber and shoelaces, but before paying for things like store rent or TV commercials.
+16.1%
+12.5%
+36.2%
Operating MarginThe 'day job' efficiency score. Out of every dollar a customer spends, this shows how many cents the company keeps after making the product AND paying for all the everyday corporate overhead (like salaries, marketing, and keeping the lights on).
+5.9%
+14.6%
+330.9%
Net MarginThe final take-home percentage. When you strip away every conceivable cost, tax, and interest payment, this is the exact number of cents the company truly gets to keep from every dollar in sales.
+4.4%
+38.4%
-318.1%
Free Cash FlowThe holy grail of corporate cash. It's the spendable, physical money left over after the business pays for its daily operations AND buys the big, expensive upgrades (like new factories or servers) it needs to survive. This is the 'free' money they can use to pay dividends or buy back stock.
$330.6M
+3.3%
+350.3%
FCF MarginThe ultimate cash conversion rate. It shows how good the company is at turning regular sales directly into cold, hard, spendable cash. A high percentage means the business is an absolute cash-printing machine.
+7.5%
-6.4%
+256.9%
Debt / EquityThe financial risk gauge. It compares how much of the company's empire was built using borrowed money (loans) versus the owners' own money (shareholders). A high number means they are heavily leveraged and playing a riskier game; a low number means they are playing it safe.
137.7%
+67.8%
+70.2%
Current RatioThe 12-month survival check. It simply compares the cash they have right now (plus things they can quickly turn into cash) against the immediate bills they absolutely must pay this year. A score above 1 means they have enough in the wallet to cover the upcoming bills without panicking.
1.22x
-26.5%
-6.7%
Total AssetsThe absolute size of the company's empire. It bundles together absolutely everything of value they own—from the cash in the register and the inventory in the warehouse, to the software patents in the vault and the factories on the ground.
Operator: Good morning. My name is Chloe, and I will be your conference facilitator today. At this time, I would like to welcome everyone to the Granite 2026 Second Quarter Conference Call. This call is being recorded. [Operator Instructions] It is now my pleasure to turn the floor over to your host, Granite Vice President of Investor Relations, Mike Barker.
Michael Barker: Good morning, and thank you for joining us. I'm pleased to be here today with President and Chief Executive Officer, Kyle Larkin; and Executive Vice President and Chief Financial Officer, Staci Woolsey. Please note that today's earnings presentation will be available on the Events and Presentations page of our Investor Relations website. We begin with a brief discussion regarding forward-looking statements and non-GAAP measures. Some of the discussion today may include forward-looking statements within the meaning of the Private Securities Litigation Reform Act of 1995. These forward-looking statements are estimates reflecting the current expectations and best judgment of senior management regarding future events, occurrences, opportunities, targets, growth, demand, strategic plans, circumstances, activities, performance, shareholder value, outcomes, outlook, guidance, objectives, committed and awarded projects, or CAP, and results. Actual results could differ materially from statements made today. Please refer to Granite's most recent 10-K and 10-Q filings for a more complete description of risk factors that could affect these forward-looking statements. The company assumes no obligation to update forward-looking statements, except as required by law. Certain non-GAAP measures may be discussed during today's call and from time to time by the company's executives. These include, but are not limited to, adjusted EBITDA, adjusted EBITDA margin, adjusted net income, adjusted earnings per share, cash gross profit and cash gross profit per ton. The required disclosures regarding our non-GAAP measures are included as part of our earnings press releases and in company presentations, which are available on our website, graniteconstruction.com, under Investor Relations. Now I'd like to turn the call over to Kyle Larkin.
Kyle Larkin: Thanks, Mike. Let's start with the Construction segment. I'm pleased to report that CAP growth continued to be strong, increasing $250 million sequentially to $7.4 billion as project wins outpaced revenue burn in what was a very strong growth quarter. The increase was driven by a healthy and active bidding environment across our market as well as the addition of Kenny Seng Construction. This record CAP underscores the strength of our end markets, the effectiveness of our growth initiatives and provides strong visibility into future revenue. We continue to see significant opportunities to grow CAP, leveraging our leadership in publicly funded transportation infrastructure while expanding our presence across a broader set of end markets. Publicly funded work …