Five Point Holdings, LLC, primarily operating through its subsidiary, Five Point Operating Company, LP, specializes in the ownership and development of large-scale, ...
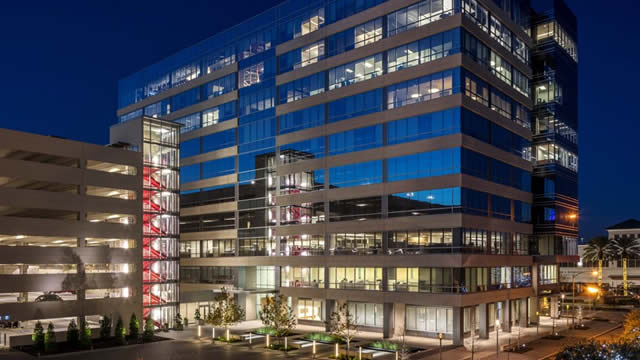
Five Point Holdings, LLC, commonly known as FivePoint, is one of the largest owners and developers of mixed-use communities in coastal California, based on the total number of homes permitted to be built. Founded in 2009 as Newhall Holding Company, LLC, and rebranded in May 2016, the company is headquartered ...Five Point Holdings, LLC, commonly known as FivePoint, is one of the largest owners and developers of mixed-use communities in coastal California, based on the total number of homes permitted to be built. Founded in 2009 as Newhall Holding Company, LLC, and rebranded in May 2016, the company is headquartered in Irvine, California, and listed on the New York Stock Exchange under the ticker FPH. The company designs and develops large-scale, multi-purpose communities in three of California's most dynamic coastal markets: Orange County, Los Angeles County, and San Francisco County. Its operations are divided into four segments: Valencia, San Francisco, Great Park, and Commercial. The primary business activity involves selling land parcels for residential and commercial construction to homebuilders, commercial developers, and other buyers. In addition, FivePoint manages and holds various properties, including commercial office spaces and a medical campus, while offering development and property management expertise. The company was founded by Emile Haddad, who serves as Chairman Emeritus, while the current CEO is Daniel C. Hedigan. With a workforce of approximately 90 employees, FivePoint manages a significant portfolio, including around 2,100 acres of land and approximately 23 million square feet of commercial space. The company's financial performance shows a market capitalization of about $371 million, with a focus on long-term development projects. FivePoint is known for its commitment to creating 'evolving cities' that integrate residential, commercial, retail, and recreational spaces, aiming to foster vibrant communities. The company has received attention for its innovative approach to urban planning and sustainability, and it continues to play a pivotal role in shaping the landscape of coastal California.
EPS estimate unavailable · Fiscal period ending 2026-09-30
D-54
5Y Trend (Revenue, Earnings, FCF)
Metric
Latest
YoYYoY means Year-over-Year. It compares the latest annual value with the previous annual value to show long-term trend strength.
QoQQoQ means Quarter-over-Quarter. It compares the latest quarter with the immediately previous quarter to show short-term momentum changes.
RevenueThe total money that came through the front door from selling things, before paying a single bill. Think of it as the grand total of every credit card swipe from customers. (YoY compares this year to last year's performance, while QoQ compares the current three months to the previous three).
$110.0M
-53.8%
-82.1%
Net IncomeThe absolute bottom line. If the company paid every single supplier, employee, banker, and tax collector, this is the actual money left in their pocket at the end of the day.
$71.0M
+3.9%
-109.6%
Gross MarginThe basic markup. If they sell a $100 pair of sneakers, this percentage tells you how much of that price tag is profit right after paying for the rubber and shoelaces, but before paying for things like store rent or TV commercials.
+40.4%
-19.1%
-39.7%
Operating MarginThe 'day job' efficiency score. Out of every dollar a customer spends, this shows how many cents the company keeps after making the product AND paying for all the everyday corporate overhead (like salaries, marketing, and keeping the lights on).
-6.7%
-123.7%
-385.5%
Net MarginThe final take-home percentage. When you strip away every conceivable cost, tax, and interest payment, this is the exact number of cents the company truly gets to keep from every dollar in sales.
+64.5%
+124.7%
-153.4%
Free Cash FlowThe holy grail of corporate cash. It's the spendable, physical money left over after the business pays for its daily operations AND buys the big, expensive upgrades (like new factories or servers) it needs to survive. This is the 'free' money they can use to pay dividends or buy back stock.
$105.0M
-8.8%
+76.8%
FCF MarginThe ultimate cash conversion rate. It shows how good the company is at turning regular sales directly into cold, hard, spendable cash. A high percentage means the business is an absolute cash-printing machine.
+95.4%
+97.2%
-29.7%
Debt / EquityThe financial risk gauge. It compares how much of the company's empire was built using borrowed money (loans) versus the owners' own money (shareholders). A high number means they are heavily leveraged and playing a riskier game; a low number means they are playing it safe.
61.4%
-23.1%
-6.6%
Current RatioThe 12-month survival check. It simply compares the cash they have right now (plus things they can quickly turn into cash) against the immediate bills they absolutely must pay this year. A score above 1 means they have enough in the wallet to cover the upcoming bills without panicking.
82.24x
-43.5%
-92.2%
Total AssetsThe absolute size of the company's empire. It bundles together absolutely everything of value they own—from the cash in the register and the inventory in the warehouse, to the software patents in the vault and the factories on the ground.
Operator: Greetings and welcome to the Five Point Holdings' Fourth Quarter and Year-End 2025 Conference Call. As a reminder, this call is being recorded. Today's call may include forward-looking statements regarding Five Point's business, financial condition, operations, cash flow, strategy, acquisitions and prospects. Forward-looking statements represent Five Point's estimates on the date of this conference call and are not intended to give any assurance as to actual future results. Because forward-looking statements relate to matters that have not yet occurred, these statements are inherently subject to risks and uncertainties. Many factors could affect future results and may cause Five Point's actual activities or results to differ materially from the activities and results anticipated in forward-looking statements. These factors include those described in today's press release and Five Point's SEC filings, including those in the Risk Factors section of Five Point's most recent annual report on Form 10-K filed with the SEC. Please note that Five Point assumes no obligation to update any forward-looking statements. Now I would like to turn over the call to Dan Hedigan, President and Chief Executive Officer.
Daniel Hedigan: Thank you, Vaughn. Good afternoon, and thank you for joining our call. I have with me today, Kim Tobler, our Chief Financial Officer; and Leo Kij, our Senior Vice President of Finance and Reporting. Stuart Miller, our Executive Chairman; and Mike Alvarado, our Chief Operating Officer and Chief Legal Officer, are joining us remotely. On today's call, I will review our fourth quarter and full year 2025 results, which marked another important milestone for Five Point. I'll discuss our operational progress during the year, highlight several major accomplishments across our communities and outline our strategic priorities as we move into 2026. Ken will then walk through our financial results in more detail and review our outlook. We'll open the line for questions following our prepared remarks. Turning first to our results. I'm very pleased to report that 2025 was another record year for Five Point despite challenging market conditions. In the fourth quarter, we generated $58.7 million in net income, resulting in annual consolidated net income of $183.5 million, exceeding our prior record set in 2024. Our net income for the year exceeded the revised guidance we issued in Q2 2025 by roughly $6 million, reflecting our team's expertise and consistent execution across our platform, disciplined capital management and continued pricing strength at the Great Park. Beyond our strong financial results, we also obtained critical entitlement approvals during the fourth quarter at both Valencia and the Great Park. I'll provide additional detail later in the community updates. These entitlements will enhance our near-term cash flows by creating a foundation for the company's future development. It goes without saying that we could not have …