Zacks Investment Research8/21/2026Neutral
Why CBRE Group (CBRE) is a Top Stock for the Long-Term
Wondering how to pick strong, market-beating stocks for your investment portfolio? Look no further than the Zacks Focus List.
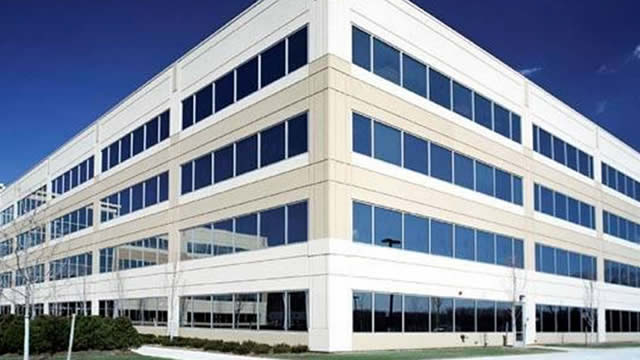
CBRE Group, Inc. operates as a commercial real estate services and investment company in the United States, the United Kingdom, and internationally. ...
Plutux is not an investment adviser. Market data and AI-generated analysis are for information and education only, not investment advice. Disclaimer
Operator: Greetings. Welcome to the CBRE Group Second Quarter 2026 Earnings Call. At this time, all participants are in a listen-only mode. Please note this conference is being recorded. I will now turn the conference over to Chandni Luthra, Global Head of FP&A and IR for CBRE. Thank you. You may begin. Chandni Luthra: Good morning, everyone. And welcome to CBRE's Second Quarter 2026 Earnings Conference Call. Earlier today, we posted a presentation deck on our website that you can use to follow along with our prepared remarks and an Excel file that contains additional supplemental materials. Today's presentation contains forward-looking statements including, without limitation, statements concerning our business outlook, business plans, capital allocation strategy as well as our earnings and free cash flow outlook. These statements involve risks, and uncertainties that may cause actual results and trends to differ materially. For a full discussion of the risks and other factors that may impact these statements, please refer to this morning's earnings release and our other SEC filings. We have provided reconciliations of our non-GAAP financial measures discussed on our call to the most directly comparable GAAP measures together with explanations of these measures in our presentation deck appendix. Throughout our remarks, when we cite financial performance relative to expectations, we are referring to actual results against the outlook we provided on our first quarter 2026 earnings call in April, unless otherwise noted. All the growth rates we cite are in U.S. dollars unless otherwise noted and reflect an FX tailwind of 1% to 2%. Also as a reminder, our resilient businesses include facilities management, critical infrastructure services, property management, project management, loan servicing, valuations, other portfolio services and recurring investment management fees. Our transactional businesses are comprised of property sales, leasing, mortgage originations, carried interest and incentive fees in the investment management business and development fees. I am joined on today's call by Robert E. Sulentic, our Chairman and CEO and Emma E. Giamartino, our Chief Financial Officer. Now please turn to slide 3 as I turn the call over to Bob. Robert E. Sulentic: Thank you, Chandni, and good morning, everyone. The momentum in CBRE's business continued in the second quarter with core EPS up 30% on a 16% revenue increase. Our strength was balanced across the company. Each of our segments advisory, building operations and experience, project management, and REI grew SOP by more than 25%. Our strategy is working the way we intended. Resources and investments are being productively directed into areas that drive current growth and position us for long-term growth. Directly related to this positioning, over the last several months, we have received many questions from investors. About our infrastructure and data center services businesses. Those businesses …
Est. EPS $7.83 · Revenue $46.72B · 8 analysts
Est. EPS $2.31 · Revenue $12.92B · 2 analysts
| Metric | Latest | YoYYoY means Year-over-Year. It compares the latest annual value with the previous annual value to show long-term trend strength. | QoQQoQ means Quarter-over-Quarter. It compares the latest quarter with the immediately previous quarter to show short-term momentum changes. |
|---|---|---|---|
| The total money that came through the front door from selling things, before paying a single bill. Think of it as the grand total of every credit card swipe from customers. (YoY compares this year to last year's performance, while QoQ compares the current three months to the previous three). |
| Name | Title | Compensation | Gender | Year Born | Status |
|---|---|---|---|---|---|
Robert E. Sulentic | Chief Executive Officer & Chairman of Board | USD 5,301,715 | Male | 1956 | Active |
Vikramaditya Kohli | Chief Operating Officer & Chief Executive Officer of Advisory Services |
| USD 4,022,917 |
| Male |
| 1980 |
| Active |
Adam Nims | Chief Executive Officer of Trammell Crow Company | USD 2,477,285 | Male | — | Active |
Daniel G. Queenan | Executive Group President | USD 2,477,285 | Male | 1973 | Active |
Emma E. Giamartino | CFO & Chief Investment Officer | USD 2,289,925 | Female | 1984 | Active |
Chad Doellinger | Chief Legal and Administrative Officer & Corporate Secretary | USD 2,183,081 | Male | 1977 | Active |
Jamie J. Hodari | CEO of Building Operations & Experience and Chief Commercial Officer | USD 2,043,426 | Male | 1982 | Active |
Arlin E. Gaffner | Chief Financial Officer of the Americas | — | Male | 1956 | Active |
Scott A. Gray-Spencer | Executive Managing Director of Private Clients Group Australia & New Zealand | — | Male | — | Active |
Chandni Luthra | Executive Vice President of Investor Relations and Financial Planning & Analysis | — | Female | — | Active |
Vincent Clancy | Chair and CEO of Turner and Townsend & Director | — | Male | 1965 | Active |
Karen Ellzey | Executive Managing Director of Consulting - Global Workplace Solutions | — | Female | — | Active |
Steven Iaco | Senior Managing Director of Corporate Communications & Investor Relations | — | Male | — | Active |
Elizabeth Atlee | Senior Vice President and Chief Ethics & Compliance Officer | — | Female | — | Active |
Anuj Kadyan | Chief Technology & Transformation Officer | — | Male | — | Active |
John Davies | Executive Director of Capital Markets - Hong Kong | — | Male | — | Active |
Est. EPS $3.36 · Revenue $14.48B · 5 analysts
Est. EPS $8.99 · Revenue $52.00B · 8 analysts
EPS $0.54 · Revenue $8.91B
| $40.5B |
| +13.4% |
| +6.6% |
| Net IncomeThe absolute bottom line. If the company paid every single supplier, employee, banker, and tax collector, this is the actual money left in their pocket at the end of the day. | $1.2B | +19.5% | -35.8% |
| Gross MarginThe basic markup. If they sell a $100 pair of sneakers, this percentage tells you how much of that price tag is profit right after paying for the rubber and shoelaces, but before paying for things like store rent or TV commercials. | +15.0% | -23.7% | +5.6% |
| Operating MarginThe 'day job' efficiency score. Out of every dollar a customer spends, this shows how many cents the company keeps after making the product AND paying for all the everyday corporate overhead (like salaries, marketing, and keeping the lights on). | +3.2% | -19.2% | -33.0% |
| Net MarginThe final take-home percentage. When you strip away every conceivable cost, tax, and interest payment, this is the exact number of cents the company truly gets to keep from every dollar in sales. | +2.9% | +5.4% | -39.8% |
| Free Cash FlowThe holy grail of corporate cash. It's the spendable, physical money left over after the business pays for its daily operations AND buys the big, expensive upgrades (like new factories or servers) it needs to survive. This is the 'free' money they can use to pay dividends or buy back stock. | $1.2B | -20.0% | +102.6% |
| FCF MarginThe ultimate cash conversion rate. It shows how good the company is at turning regular sales directly into cold, hard, spendable cash. A high percentage means the business is an absolute cash-printing machine. | +2.9% | -29.5% | +102.5% |
| Debt / EquityThe financial risk gauge. It compares how much of the company's empire was built using borrowed money (loans) versus the owners' own money (shareholders). A high number means they are heavily leveraged and playing a riskier game; a low number means they are playing it safe. | 112.5% | +66.2% | +34.9% |
| Current RatioThe 12-month survival check. It simply compares the cash they have right now (plus things they can quickly turn into cash) against the immediate bills they absolutely must pay this year. A score above 1 means they have enough in the wallet to cover the upcoming bills without panicking. | 1.09x | +2.0% | +5.3% |
| Total AssetsThe absolute size of the company's empire. It bundles together absolutely everything of value they own—from the cash in the register and the inventory in the warehouse, to the software patents in the vault and the factories on the ground. | $30.9B | +26.6% | +1.0% |
| Metric | Annual (A vs E) | Annual Surprise | Quarter (A vs E) | Quarter Surprise |
|---|---|---|---|---|
| EPS Surprise | 3.85 vs 6.33 | -39.2% | 0.69 vs 2.31 | -70.1% |
| Revenue Surprise | $40.5B vs $40.5B | +0.2% | $11.2B vs $12.9B | -13.1% |
| Date | Executive | Title | Security | Side | Shares | Price |
|---|---|---|---|---|---|---|
| Aug 13, 2026 | Giamartino Emma E. | officer: CFO & Chief Investment Officer | Class A Common Stock | D | 2,250 | $148.29 |
| Aug 13, 2026 | Doellinger Chad J | officer: Chief Legal & Admin. Officer | Class A Common Stock | D | 228 | $148.29 |
| Jul 29, 2026 | Kohli Vikramaditya | officer: COO & CEO, Advisory Services | Class A Common Stock | D | 2,666 | $150.00 |
| May 28, 2026 | Kadyan Anuj | officer: Chief Tech. & Transf. Officer | Class A Common Stock | — | 0 | — |
| May 27, 2026 | Cobert Beth F. | director | Class A Common Stock | A | 2,068 | — |