A2Z Smart Technologies Corp. (symbol AZ) is a company that delivers sophisticated engineering solutions, primarily serving the defense and security industries, including ...
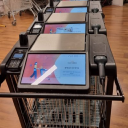
A2Z Cust2Mate Solutions Corp. (NASDAQ: AZ) is a technology company focused on improving in-store retail operations and customer experience through automation and data-enabled shopping. The company’s flagship initiative is Cust2Mate, a smart cart platform designed for grocery retailers. Cust2Mate aims to modernize the shopping workflow by combining capabilities such as ...A2Z Cust2Mate Solutions Corp. (NASDAQ: AZ) is a technology company focused on improving in-store retail operations and customer experience through automation and data-enabled shopping. The company’s flagship initiative is Cust2Mate, a smart cart platform designed for grocery retailers. Cust2Mate aims to modernize the shopping workflow by combining capabilities such as scan-and-go experiences, on-cart payment, and the use of in-store data insights. In addition to enabling smoother checkout and shopper engagement, the platform supports retail media and store analytics—effectively helping retailers monetize physical store environments and measure performance at the moment of shopping.
From a product and service perspective, A2Z’s offerings are best understood as a recurring technology and deployment model for retail operators: retailers adopt the smart-cart solution ecosystem, which then produces ongoing usage and data outputs that can be used for engagement, operational insights, and advertising/retail media monetization. This aligns with public investor-material descriptions that highlight a hybrid approach to revenue generation across outright solutions, subscription-like components, and data/retail-media monetization. The company also provides services related to maintenance, calibration, and support for complex electronic systems—supporting long-term customer relationships and ensuring installed systems remain reliable.
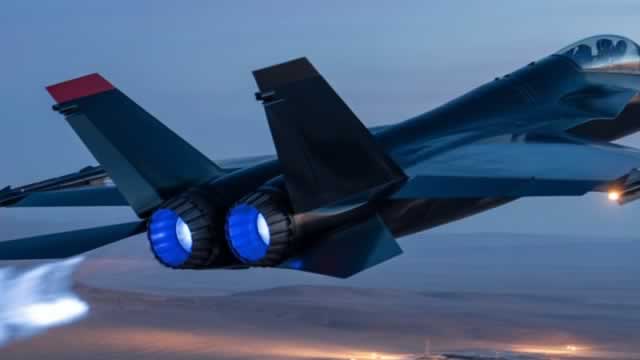
Separately, A2Z has a defense and security technology component. The provided description indicates that the company has worked with sophisticated engineering solutions for defense/security sectors, including remote-controlled unmanned vehicles and specialized energy-related power packs and containment technologies intended to reduce safety risks (e.g., fuel-tank related containment approaches). While the defense segment is distinct from retail grocery automation, it demonstrates A2Z’s engineering background in electronics and systems development.
Operationally, A2Z is headquartered in Vancouver, Canada, while serving customers across Israel and internationally. The company’s leadership is led by CEO Gadi Graus (with additional leadership roles referenced in the provided materials). Financially, the supplied FMP snapshot includes a relatively high price-to-sales multiple and negative margins/earnings metrics on a trailing-twelve-month basis, suggesting the business may be in an investment or growth phase rather than current profitability at the snapshot time. Reported liquidity indicators (e.g., relatively strong current ratio/quick ratio figures in the snapshot) point to the importance of working-capital management for scaling deployments.
In terms of cost and bill-of-materials (BOM) considerations, smart-cart systems typically involve integrated hardware, sensors/scanners, payment components, connectivity modules, and supportive software/analytics infrastructure. For A2Z, the ability to scale hardware deployments and keep per-cart economics competitive (while maintaining system reliability and customer uptime) is likely central to long-term margins. Additionally, ongoing software operations—analytics, retail-media enablement, and customer data pipelines—create a continuing cost base but also create potential for recurring revenue per deployed location.
Looking ahead (“wishes” and strategic priorities), the company’s disclosed growth and deployment focus implies targets such as expanding retailer rollouts, strengthening retail-media and analytics revenue streams, improving unit economics, and sustaining product roadmap execution. Achieving durable profitability would likely depend on scaling installations, optimizing hardware and support costs, and converting early deployments into repeatable multi-store programs with measurable impact for retail customers.
YoYYoY means Year-over-Year. It compares the latest annual value with the previous annual value to show long-term trend strength.
QoQQoQ means Quarter-over-Quarter. It compares the latest quarter with the immediately previous quarter to show short-term momentum changes.
RevenueThe total money that came through the front door from selling things, before paying a single bill. Think of it as the grand total of every credit card swipe from customers. (YoY compares this year to last year's performance, while QoQ compares the current three months to the previous three).
$7.9M
+10.3%
+78.0%
Net IncomeThe absolute bottom line. If the company paid every single supplier, employee, banker, and tax collector, this is the actual money left in their pocket at the end of the day.
$-37.7M
-122.0%
+11.3%
Gross MarginThe basic markup. If they sell a $100 pair of sneakers, this percentage tells you how much of that price tag is profit right after paying for the rubber and shoelaces, but before paying for things like store rent or TV commercials.
+13.8%
-50.0%
+915.3%
Operating MarginThe 'day job' efficiency score. Out of every dollar a customer spends, this shows how many cents the company keeps after making the product AND paying for all the everyday corporate overhead (like salaries, marketing, and keeping the lights on).
-461.4%
-125.9%
+46.9%
Net MarginThe final take-home percentage. When you strip away every conceivable cost, tax, and interest payment, this is the exact number of cents the company truly gets to keep from every dollar in sales.
-477.6%
-101.4%
+50.2%
Free Cash FlowThe holy grail of corporate cash. It's the spendable, physical money left over after the business pays for its daily operations AND buys the big, expensive upgrades (like new factories or servers) it needs to survive. This is the 'free' money they can use to pay dividends or buy back stock.
$-24.0M
-102.5%
-21.6%
FCF MarginThe ultimate cash conversion rate. It shows how good the company is at turning regular sales directly into cold, hard, spendable cash. A high percentage means the business is an absolute cash-printing machine.
-303.7%
-83.6%
+31.7%
Debt / EquityThe financial risk gauge. It compares how much of the company's empire was built using borrowed money (loans) versus the owners' own money (shareholders). A high number means they are heavily leveraged and playing a riskier game; a low number means they are playing it safe.
3.4%
-66.5%
+101.8%
Current RatioThe 12-month survival check. It simply compares the cash they have right now (plus things they can quickly turn into cash) against the immediate bills they absolutely must pay this year. A score above 1 means they have enough in the wallet to cover the upcoming bills without panicking.
11.42x
+669.3%
-28.9%
Total AssetsThe absolute size of the company's empire. It bundles together absolutely everything of value they own—from the cash in the register and the inventory in the warehouse, to the software patents in the vault and the factories on the ground.