Zacks Investment Research8/5/2026Neutral
Here's Why ATI (ATI) is a Strong Growth Stock
Wondering how to pick strong, market-beating stocks for your investment portfolio? Look no further than the Zacks Style Scores.
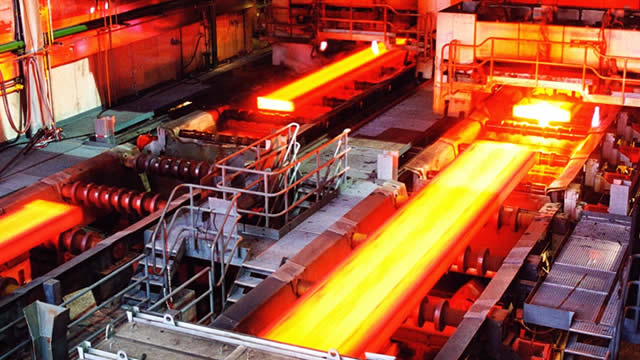
Globally, ATI Inc. stands as a premier manufacturer and supplier of specialized materials and complex components. The enterprise's operations are strategically divided ...
Plutux is not an investment adviser. Market data and AI-generated analysis are for information and education only, not investment advice. Disclaimer
Est. EPS $1.34 · Revenue $1.32B · 5 analysts
Est. EPS $5.05 · Revenue $5.13B · 6 analysts
Est. EPS $1.36 · Revenue $1.27B · 2 analysts
Est. EPS $1.49 · Revenue $1.37B · 2 analysts
EPS $0.67 · Revenue $1.14B
| Metric | Latest | YoYYoY means Year-over-Year. It compares the latest annual value with the previous annual value to show long-term trend strength. | QoQQoQ means Quarter-over-Quarter. It compares the latest quarter with the immediately previous quarter to show short-term momentum changes. |
|---|---|---|---|
| RevenueThe total money that came through the front door from selling things, before paying a single bill. Think of it as the grand total of every credit card swipe from customers. (YoY compares this year to last year's performance, while QoQ compares the current three months to the previous three). | $4.6B | +5.2% | +9.5% |
| Net IncomeThe absolute bottom line. If the company paid every single supplier, employee, banker, and tax collector, this is the actual money left in their pocket at the end of the day. | $404.3M | +9.9% | +27.7% |
| Gross MarginThe basic markup. If they sell a $100 pair of sneakers, this percentage tells you how much of that price tag is profit right after paying for the rubber and shoelaces, but before paying for things like store rent or TV commercials. | +21.8% | +4.1% | +7.6% |
| Operating MarginThe 'day job' efficiency score. Out of every dollar a customer spends, this shows how many cents the company keeps after making the product AND paying for all the everyday corporate overhead (like salaries, marketing, and keeping the lights on). | +13.8% | -0.9% | +17.6% |
| Net MarginThe final take-home percentage. When you strip away every conceivable cost, tax, and interest payment, this is the exact number of cents the company truly gets to keep from every dollar in sales. | +8.8% | +4.5% | +16.6% |
| Free Cash FlowThe holy grail of corporate cash. It's the spendable, physical money left over after the business pays for its daily operations AND buys the big, expensive upgrades (like new factories or servers) it needs to survive. This is the 'free' money they can use to pay dividends or buy back stock. | $333.7M | +98.5% | -13.4% |
| FCF MarginThe ultimate cash conversion rate. It shows how good the company is at turning regular sales directly into cold, hard, spendable cash. A high percentage means the business is an absolute cash-printing machine. | +7.3% | +88.8% | -20.9% |
| Debt / EquityThe financial risk gauge. It compares how much of the company's empire was built using borrowed money (loans) versus the owners' own money (shareholders). A high number means they are heavily leveraged and playing a riskier game; a low number means they are playing it safe. | 107.9% | +5.4% | +13.1% |
| Current RatioThe 12-month survival check. It simply compares the cash they have right now (plus things they can quickly turn into cash) against the immediate bills they absolutely must pay this year. A score above 1 means they have enough in the wallet to cover the upcoming bills without panicking. | 2.66x | +9.3% | -12.9% |
| Total AssetsThe absolute size of the company's empire. It bundles together absolutely everything of value they own—from the cash in the register and the inventory in the warehouse, to the software patents in the vault and the factories on the ground. | $5.1B | -2.5% | +9.6% |
| Metric | Annual (A vs E) | Annual Surprise | Quarter (A vs E) | Quarter Surprise |
|---|---|---|---|---|
| EPS Surprise | 2.85 vs 3.18 | -10.4% | 1.09 vs 1.34 | -18.7% |
| Revenue Surprise | $4.6B vs $4.6B | -0.2% | $1.3B vs $1.3B | -4.1% |
| Date | Executive | Title | Security | Side | Shares | Price |
|---|---|---|---|---|---|---|
| Dec 31, 2029 | Foster James Robert | officer: SVP, Finance and CFO | Performance Stock Units | — | 17,094 | — |
| Aug 31, 2026 | Harris Timothy J | officer: Senior VP and CDIO | Common Stock, par value $0.10 per share | D | 16,500 | $210.01 |
| Aug 24, 2026 | Harris Timothy J | officer: Senior VP and CDIO | Common Stock, par value $0.10 per share | D | 16,500 | $206.92 |
| Aug 17, 2026 | Fields Kimberly A | director, officer: Chair, President and CEO | Common Stock, par value $0.10 per share | D | 1,000 | $228.32 |
| Aug 17, 2026 | Fields Kimberly A | director, officer: Chair, President and CEO | Common Stock, par value $0.10 per share | D | 2,000 | $229.56 |
Operator: Thank you for joining us, and welcome to the ATI Second Quarter 2026 Results Conference Call. [Operator Instructions] I will now hand the conference over to Rob Rengel, Vice President of Investor Relations. Please go ahead. Rob Rengel: Good morning, and welcome to ATI's Second Quarter 2026 Earnings Call. I'm excited to step into this role, and I want to begin by recognizing Dave Weston and the significant contributions he made to ATI before his retirement. Today's discussion is being webcast at atimaterials.com. Joining me are Kim Fields, Board Chair, President and CEO; and Rob Foster, Senior Vice President and CFO. Before starting our prepared remarks, I would like to draw your attention to the supplemental presentation that accompanies this call. Those slides provide additional color and details on our results, capabilities and outlook and can also be found on our website. As a reminder, all forward-looking statements are subject to various assumptions and caveats. These are noted in the earnings release and in the accompanying presentation. After our prepared remarks, we'll open the line for questions. Now I'll turn the call over to Kim. Kimberly Fields: Thanks, Rob, and welcome to the team, and good morning, everyone. Thank you for joining us. Turning to Slide 3. ATI delivered another strong quarter, demonstrating the increasing earnings power of our business. Second quarter adjusted EBITDA was $284 million, $29 million above the high end of our prior guidance. Excluding a $10 million asset sale gain, underlying performance still exceeded the high end of our guidance by $19 million. Adjusted EBITDA increased 37% year-over-year, making this ATI's strongest quarterly EBITDA performance since 2007. Second quarter adjusted EBITDA margins expanded 440 basis points year-over-year to 22.6%, reflecting stronger commercial terms, favorable mix, disciplined execution and operational improvements through Elevation. Revenue this quarter increased 11% year-over-year to $1.3 billion, an annualized run rate of more than $5 billion. That expanding revenue was supported by another record backlog of $4.4 billion, up 18% from a year ago and 7% sequentially. Importantly, that backlog increasingly reflects long-term agreements, sole-source positions and strategic programs that provide meaningful multiyear visibility into future shipments and earnings. Adjusted free cash flow in the quarter was $69 million, bringing first half free cash flow to $143 million, an improvement of $193 million versus the first half of last year. Cash generation will accelerate meaningfully in the second half, putting us on track to generate positive free cash flow in every quarter of 2026. Our second quarter performance was led by our AA&S segment, and it's one of the most important stories from the quarter. Over the last several years, we've transformed AA&S. What was once viewed as a more cyclical, lower-margin business has become a second durable earnings engine for ATI. …
| Name | Title | Compensation | Gender | Year Born | Status |
|---|---|---|---|---|---|
Kimberly A. Fields | President, CEO & Chair | USD 3,461,037 | Female | 1970 | Active |
Vaishali S. Bhatia | Senior Vice President, General Counsel & Chief Compliance Officer | USD 1,826,812 | Female | 1983 | Active |
Timothy J. Harris | Senior Vice President and Chief Digital & Information Officer | USD 1,322,026 | Male | 1975 | Active |
Michael Benjamin Miller | Vice President, Corporate Controller & Chief Accounting Officer | — | Male | 1976 | Active |
Tom Wright | Vice President of Financial Planning & Analysis | — | Male | — | Active |
David Weston | Vice President of Investor Relations | — | Male | — | Active |
James Robert Foster | Senior VP of Finance & CFO | — | Male | 1981 | Active |
John S. Minich | President of Forged Products | — | Male | 1962 | Active |
Amanda J. Skov | Corporate Secretary | — | Female | — | Active |
Wondering how to pick strong, market-beating stocks for your investment portfolio? Look no further than the Zacks Style Scores.
Cetera Investment Advisers boosted its stake in shares of ATI Inc. (NYSE: ATI) by 75.7% in the undefined quarter, according to the company in its most recent disclosure with the SEC. The firm owned 26,675 shares of the basic materials company's stock after buying an additional 11,492 shares during the quarter. Cetera Investment
ATI heads into Q2 earnings with rising aerospace demand, strategic investments and a 6.98% revenue growth estimate supporting expectations for a beat.
Looking beyond Wall Street's top-and-bottom-line estimate forecasts for ATI (ATI), delve into some of its key metrics to gain a deeper insight into the company's potential performance for the quarter ended June 2026.
Here is how ATI (ATI) and Rolls-Royce Holdings PLC (RYCEY) have performed compared to their sector so far this year.