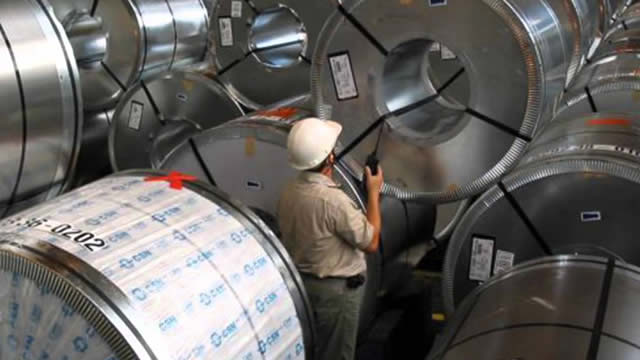
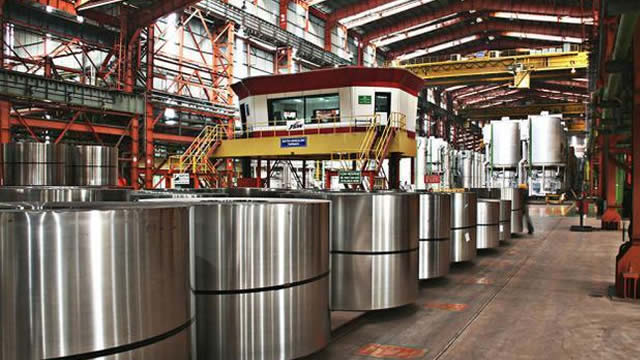
Insteel Industries, Inc., along with its various subsidiaries, focuses on the manufacturing and commercialization of steel wire reinforcement products specifically for concrete ...
Insteel Industries, Inc. (NYSE: IIIN) is a leading manufacturer of steel wire reinforcement products for concrete construction, with a market cap of approximately $625 million. The company, founded in 1953 by Howard O. Woltz Jr. and headquartered in Mount Airy, North Carolina, operates through its wholly-owned subsidiaries. Insteel's product portfolio ...Insteel Industries, Inc. (NYSE: IIIN) is a leading manufacturer of steel wire reinforcement products for concrete construction, with a market cap of approximately $625 million. The company, founded in 1953 by Howard O. Woltz Jr. and headquartered in Mount Airy, North Carolina, operates through its wholly-owned subsidiaries. Insteel's product portfolio centers on two main lines: prestressed concrete strand (PC strand) and welded wire reinforcement (WWR). PC strand is a seven-wire product used to add compression strength to precast concrete elements in bridges, parking garages, commercial buildings, and other infrastructure. WWR products include engineered structural mesh, concrete pipe reinforcement, and standard welded wire reinforcement for crack control in residential and light commercial applications. These products are distributed through a network of sales representatives to concrete product manufacturers, rebar fabricators, distributors, and contractors. Financially, Insteel reported a trailing twelve-month revenue per share of $36.38, a net profit margin of 5.1%, and a return on equity of 9.9%. The company maintains a low debt-to-equity ratio of 0.007, reflecting a conservative capital structure. Insteel's leadership is headed by CEO Howard O. Woltz III, who also serves as Chairman and President. The company employs approximately 1,007 full-time workers and recently paid a dividend of $1.12 per share, indicating a commitment to shareholder returns. Insteel's long history and focus on innovation in steel reinforcement have solidified its position as a key player in the concrete construction supply chain, with operations spanning multiple U.S. facilities and a growing international market presence.
YoYYoY means Year-over-Year. It compares the latest annual value with the previous annual value to show long-term trend strength.
QoQQoQ means Quarter-over-Quarter. It compares the latest quarter with the immediately previous quarter to show short-term momentum changes.
RevenueThe total money that came through the front door from selling things, before paying a single bill. Think of it as the grand total of every credit card swipe from customers. (YoY compares this year to last year's performance, while QoQ compares the current three months to the previous three).
$647.7M
+22.4%
+14.5%
Net IncomeThe absolute bottom line. If the company paid every single supplier, employee, banker, and tax collector, this is the actual money left in their pocket at the end of the day.
$41.0M
+112.5%
+72.9%
Gross MarginThe basic markup. If they sell a $100 pair of sneakers, this percentage tells you how much of that price tag is profit right after paying for the rubber and shoelaces, but before paying for things like store rent or TV commercials.
+14.4%
+53.8%
+6.5%
Operating MarginThe 'day job' efficiency score. Out of every dollar a customer spends, this shows how many cents the company keeps after making the product AND paying for all the everyday corporate overhead (like salaries, marketing, and keeping the lights on).
+8.4%
+121.9%
+49.2%
Net MarginThe final take-home percentage. When you strip away every conceivable cost, tax, and interest payment, this is the exact number of cents the company truly gets to keep from every dollar in sales.
+6.3%
+73.6%
+51.0%
Free Cash FlowThe holy grail of corporate cash. It's the spendable, physical money left over after the business pays for its daily operations AND buys the big, expensive upgrades (like new factories or servers) it needs to survive. This is the 'free' money they can use to pay dividends or buy back stock.
$18.9M
-51.5%
+1145.2%
FCF MarginThe ultimate cash conversion rate. It shows how good the company is at turning regular sales directly into cold, hard, spendable cash. A high percentage means the business is an absolute cash-printing machine.
+2.9%
-60.4%
+987.6%
Debt / EquityThe financial risk gauge. It compares how much of the company's empire was built using borrowed money (loans) versus the owners' own money (shareholders). A high number means they are heavily leveraged and playing a riskier game; a low number means they are playing it safe.
1.1%
+118.4%
-16.8%
Current RatioThe 12-month survival check. It simply compares the cash they have right now (plus things they can quickly turn into cash) against the immediate bills they absolutely must pay this year. A score above 1 means they have enough in the wallet to cover the upcoming bills without panicking.
3.97x
-30.2%
-3.8%
Total AssetsThe absolute size of the company's empire. It bundles together absolutely everything of value they own—from the cash in the register and the inventory in the warehouse, to the software patents in the vault and the factories on the ground.
Operator: Hello, everyone. Thank you for joining us, and welcome to the Insteel Industries Third Quarter 26 earnings call. After today's prepared remarks, we will host a question-and-answer session. If you would like to ask a question, please press 1. To raise your hand. To withdraw your question, press 1 again. I will now hand the conference over to H. Woltz, president and chief executive officer. H, please go ahead.
Howard Osler Woltz: Thank you. Good morning. Thank you for your interest in Insteel. And welcome to our third quarter 26 conference call which will be conducted by Scot R. Jafroodi, our Vice President, CFO and Treasurer; and me. Before we begin, let me remind you that some of the comments made in our presentation are considered to be forward looking statements that are subject to various risks and uncertainties which could cause actual results to differ materially from those projected. These risk factors are described in our periodic filings with the SEC. Despite falling short of our expected financial performance, in Q3, we believe the upturn in business activity we reported previously is still intact. I will turn the call over to Scot to comment on our financial results. And following his comments, I will pick the call back up to discuss our business outlook.
Scot R. Jafroodi: Thank you, H. And good morning to everyone joining us on the call. As reported in our earnings release this morning, third quarter results benefited from higher average selling prices and improved shipment activity. However, those benefits were more than offset by higher costs. Resulting in net earnings of $9 million or $0.46 per share compared with $15.2 million or $0.78 per share in the prior year quarter, Despite the decline in earnings, underlying demand trends remain generally favorable. Third quarter shipments increased 1.7% from the prior year quarter, supported by healthy infrastructure activity, although conditions across much of the broader private nonresidential construction market remain soft. Wet weather in certain regions, together with scheduling and delivery delays on several customer projects, including data center related projects, moderated the pace of shipments during the quarter. Continue to view these project delays as timing related rather than indications of weakening underlying demand. Overall, customer sentiment remains positive and activity across our key markets continue to support our outlook. Turning to pricing. Average selling prices increased 8.1% from the prior year quarter and 2.3% sequentially from the second quarter. Reflecting the continued benefit of pricing actions implemented over the past year in response to higher steel wire rod, freight, and other operating costs. Gross profit for the quarter declined to $10.8 million in the prior year period and gross margin contracted by 690 basis points to 10.2% from 17.1%. The year over year decline was driven primarily by narrow spread between selling prices and raw material …