Zacks Investment Research8/13/2026Neutral
Ark Restaurants Stock Dips Post Q3 Earnings, Revenues Decline Y/Y
ARKR's third-quarter fiscal 2026 revenues weaken as softer same-store sales and regional pressures offset a sharply narrower net loss.
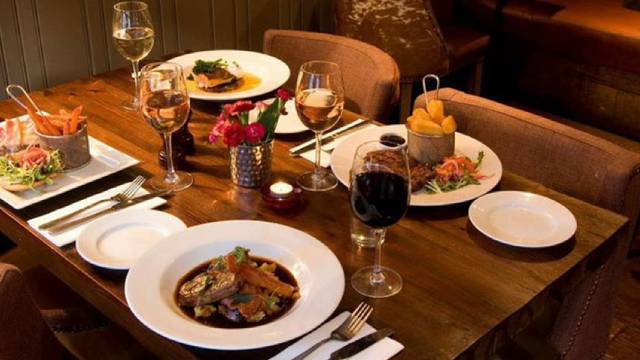
Ark Restaurants Corp. is a hospitality company that owns and manages a diverse portfolio of restaurants and bars throughout the United States, ...
Plutux is not an investment adviser. Market data and AI-generated analysis are for information and education only, not investment advice. Disclaimer
| Metric | Latest | YoYYoY means Year-over-Year. It compares the latest annual value with the previous annual value to show long-term trend strength. | QoQQoQ means Quarter-over-Quarter. It compares the latest quarter with the immediately previous quarter to show short-term momentum changes. |
|---|---|---|---|
| RevenueThe total money that came through the front door from selling things, before paying a single bill. Think of it as the grand total of every credit card swipe from customers. (YoY compares this year to last year's performance, while QoQ compares the current three months to the previous three). | $165.8M | -9.7% | +11.7% |
| Net IncomeThe absolute bottom line. If the company paid every single supplier, employee, banker, and tax collector, this is the actual money left in their pocket at the end of the day. | $-11.5M | -194.3% | +80.8% |
| Gross MarginThe basic markup. If they sell a $100 pair of sneakers, this percentage tells you how much of that price tag is profit right after paying for the rubber and shoelaces, but before paying for things like store rent or TV commercials. | +35.6% | -4.2% | -76.9% |
| Operating MarginThe 'day job' efficiency score. Out of every dollar a customer spends, this shows how many cents the company keeps after making the product AND paying for all the everyday corporate overhead (like salaries, marketing, and keeping the lights on). | -0.8% | -147.9% | +92.4% |
| Net MarginThe final take-home percentage. When you strip away every conceivable cost, tax, and interest payment, this is the exact number of cents the company truly gets to keep from every dollar in sales. | -6.9% | -225.9% | +82.8% |
| Free Cash FlowThe holy grail of corporate cash. It's the spendable, physical money left over after the business pays for its daily operations AND buys the big, expensive upgrades (like new factories or servers) it needs to survive. This is the 'free' money they can use to pay dividends or buy back stock. | $-1.5M | -168.3% | +31.9% |
| FCF MarginThe ultimate cash conversion rate. It shows how good the company is at turning regular sales directly into cold, hard, spendable cash. A high percentage means the business is an absolute cash-printing machine. | -0.9% | -175.6% | +39.0% |
| Debt / EquityThe financial risk gauge. It compares how much of the company's empire was built using borrowed money (loans) versus the owners' own money (shareholders). A high number means they are heavily leveraged and playing a riskier game; a low number means they are playing it safe. | 262.0% | +20.7% | -2.0% |
| Current RatioThe 12-month survival check. It simply compares the cash they have right now (plus things they can quickly turn into cash) against the immediate bills they absolutely must pay this year. A score above 1 means they have enough in the wallet to cover the upcoming bills without panicking. | 0.77x | +21.8% | -10.8% |
| Total AssetsThe absolute size of the company's empire. It bundles together absolutely everything of value they own—from the cash in the register and the inventory in the warehouse, to the software patents in the vault and the factories on the ground. | $133.5M | -14.4% | -2.2% |
| Metric | Annual (A vs E) | Annual Surprise | Quarter (A vs E) | Quarter Surprise |
|---|---|---|---|---|
| EPS Surprise | -3.18 vs 0.98 | -424.5% | -0.10 vs 1.58 | -106.3% |
| Revenue Surprise | $165.8M vs $55.9M | +196.3% | $40.9M vs $1.4M | +2839.2% |
| Date | Executive | Title | Security | Side | Shares | Price |
|---|---|---|---|---|---|---|
| Aug 18, 2025 | WEINSTEIN MICHAEL LAWRENCE | director, 10 percent owner, officer: Chairman & CEO | Common Stock | A | 3,000 | $7.50 |
| Aug 14, 2025 | WEINSTEIN MICHAEL LAWRENCE | director, 10 percent owner, officer: Chairman & CEO | Common Stock | A | 545 | $7.30 |
| Aug 6, 2025 | SATTERFIELD THOMAS A JR | 10 percent owner | Common Stock | A | 12,125 | $7.48 |
| Aug 5, 2025 | SATTERFIELD THOMAS A JR | 10 percent owner | Common Stock | A | 25,000 | $6.71 |
| Aug 5, 2025 | SATTERFIELD THOMAS A JR | 10 percent owner | Common Stock | A | 20,916 | $6.82 |
Operator: Please note this conference is being recorded. I will now turn the conference over to Christopher Love, Secretary. Thank you. You may begin. Christopher Love: Thank you, operator. Good morning, and thank you for joining us on our conference call for the third quarter ended June 27, 2026. My name is Christopher Love, and I am the Secretary of Ark Restaurants. With me on the call today is Michael Weinstein, our Chairman and CEO, and Anthony Sirica, our President and CFO. For those of you who have not yet obtained a copy of our press release, it was issued over the Newswire yesterday and is available on our website. To review the full text of that press release, along with the associated financial tables, please go to our homepage at www.arcrestaurants.com. Before we begin, however, I'd like to read the Safe Harbor statement. I need to remind everyone that part of our discussion this morning will include forward-looking statements and that these statements are not guarantees of future performance, and therefore undue reliance should not be placed on them. We refer everyone to our filings with the Securities and Exchange Commission for a more detailed discussion of the risks that may have a direct bearing on our operating results, performance, and financial condition. I'll now turn the call over to Anthony. Anthony Sirica: Morning, everyone. A couple of things I want to go over before we turn it over to Michael. Our cash is $9.4 million. Our debt is $7.1 million, which is up about $4.5 million from the prior quarter. We drew down $5 million in April, I believe it was, to finance the construction of America in Las Vegas. Our EBITDA for 13 weeks ended June compared to the prior year was down $1.4 million. That's the result primarily of a decrease in sales and gross margin of about 6.5% without a corresponding decrease in payrolls for the quarter, which have been stubborn. A decrease in sales is generally related to two markets. Las Vegas was off 11%. That is due to lower traffic, as we all read in the news, as well as the partial closure of America, which should be fully reopening by September sometime. Florida was off 10% as well in the quarter. It continues to be a challenging local economic climate, which is resulting in lower headcounts. Excluding updates to Bryant Park and the Meadowlands situation, which Michael will speak to, the only other item of note in the quarter is that we finalized a 2-year lease restructure at Sequoia in early July, and we expect that to provide savings of somewhere $200,000-$300,000 a year. I'll turn it over to Michael. Michael Weinstein: Several comments before I get into Bryant Park situation and the Meadowlands. Despite the fact that sales are off 10% or 11% at New York-New York, our cash flow has improved from last year. We have great management there. They've really become more efficient, and we just look forward to sales returning and the efficiencies to yield even better cash flow. At New York-New …
| Name | Title | Compensation | Gender | Year Born | Status |
|---|---|---|---|---|---|
Michael Weinstein | Founder, Chairman & Chief Executive Officer | USD 825,000 | Male | 1943 | Active |
Anthony J. Sirica | Chief Financial Officer, President,Treasurer & Director | USD 550,000 | Male | 1964 | Active |
Jennifer Jordan | Co-Chief Operating Officer | USD 193,269 | Female | 1965 | Active |
Samuel Weinstein | Co-Chief Operating Officer | USD 193,269 | Male | 1995 | Active |
Walter Rauscher | Vice President of Corporation Sales & Catering | — | — | — | Active |
Christopher Love | Secretary | — | — | — | Active |
Evyette Ortiz | Director of Marketing | — | — | — | Active |
Nancy Alvarez | Controller | — | — | — | Active |
Guisela Nunez | Director of Human Resources | — | — | — | Active |
ARKR's third-quarter fiscal 2026 revenues weaken as softer same-store sales and regional pressures offset a sharply narrower net loss.
Ark Restaurants Corp. (ARKR) Q3 2026 Earnings Call Prepared Remarks Transcript

NEW YORK--(BUSINESS WIRE)--Ark Restaurants Corp. (NASDAQ:ARKR) today reported financial results for the third quarter ended June 27, 2026. "We have two markets where we continue to perform well. Our operations at the New York-New York Hotel and Casino in Las Vegas continue to show increased cash flow despite lower customer traffic on the Las Vegas Strip. Our Alabama locations have shown strong growth in both revenue and cash flow. In NYC, Robert continues to improve on a year-over-year basis; h.

NEW YORK--(BUSINESS WIRE)--Ark Restaurants Corp. (NASDAQ:ARKR) will hold a conference call for investors and analysts to discuss financial results for the third quarter ended June 27, 2026 on Tuesday, August 11, 2026 at 11:00 a.m. Eastern Time. The dial-in numbers to participate in the conference call are: Toll-Free – 1-877-407-4018 Toll/International – 1-201-689-8471 Participants can also access the conference call by visiting Call me™ at: https://callme.viavid.com/viavid/?callme=true&pass.