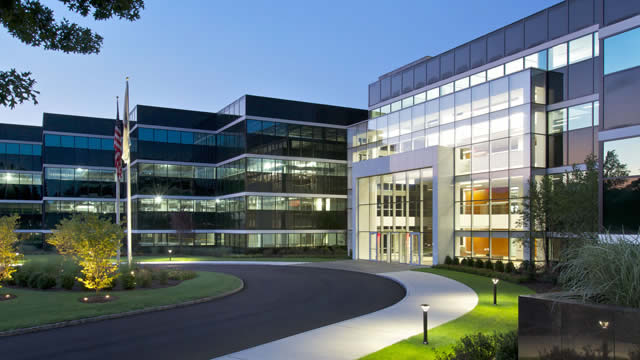
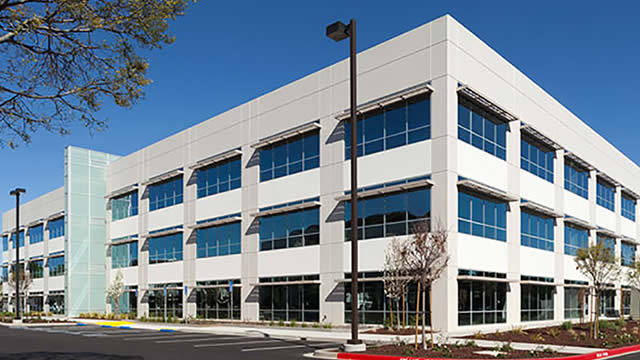
American Assets Trust, Inc. (AAT) operates as a fully integrated and internally managed real estate investment trust (REIT), headquartered in San Diego, ...
American Assets Trust, Inc. is a publicly traded U.S. real estate investment trust listed on the New York Stock Exchange under the symbol AAT. Headquartered in San Diego, California, the company operates as a full-service, vertically integrated, self-administered, and internally managed REIT. Its activities cover the full property life cycle, ...American Assets Trust, Inc. is a publicly traded U.S. real estate investment trust listed on the New York Stock Exchange under the symbol AAT. Headquartered in San Diego, California, the company operates as a full-service, vertically integrated, self-administered, and internally managed REIT. Its activities cover the full property life cycle, including acquisitions, redevelopment, development, leasing, property management, asset management, and disposition. This integrated structure allows AAT to retain greater control over operating decisions, tenant relationships, capital projects, and property-level execution than a business that relies primarily on outside managers.
AAT's portfolio is diversified across office, retail, residential, and mixed-use real estate. Based on the supplied company description, its holdings include approximately 3.4 million rentable square feet of office properties, about 3.1 million square feet of retail holdings, approximately 2,112 multifamily residential units, and a mixed-use asset with roughly 97,000 rentable square feet of retail space and a 369-room all-suite hotel. The company emphasizes high-quality assets in markets with economic growth, desirable demographics, constrained development opportunities, and high barriers to entry. Its principal geographic exposure includes Southern and Northern California, Oregon, Washington, Texas, and Hawaii.
The company traces its operating heritage to American Assets, Inc., a privately held corporation founded in 1967 by Ernest Rady. American Assets Trust, Inc. was formed in 2011 to succeed to that predecessor's real estate business and subsequently became a public company. Adam Wyll has served as president and chief executive officer since January 2025, after more than two decades in progressively senior positions at the organization. Ernest Rady remains an important historical figure and serves as executive chairman, while Robert Barton is executive vice president and chief financial officer.
As a REIT, AAT primarily generates revenue from rents, tenant reimbursements, hotel operations, and related property services rather than from manufacturing or selling physical products. Consequently, its cost structure is driven by property operating expenses, utilities, repairs and maintenance, real estate taxes, insurance, payroll, interest expense, capital improvements, redevelopment spending, and financing costs. The company's economic performance is sensitive to occupancy, rental rates, lease renewals, tenant credit quality, interest rates, property valuations, construction costs, and local market conditions. Its capital-intensive business has significant depreciation and amortization, making funds from operations, or FFO, an important supplemental performance measure alongside net income and cash flow.
The supplied trailing data indicates approximately $1.40 billion of market capitalization, an enterprise value of about $2.98 billion, a dividend of $1.36 per share, and a dividend yield near 6%. It also shows substantial leverage, with debt representing approximately 58% of assets and debt-to-equity of roughly 1.5 times. These figures highlight both the income-oriented nature of the REIT and the importance of balance-sheet management. AAT's investment proposition generally depends on preserving occupancy, increasing rents, completing profitable redevelopment, maintaining asset quality, managing debt maturities, and sustaining reliable cash distributions. Investors should verify current portfolio figures, guidance, dividend coverage, debt terms, and financial results in the company's latest SEC filings and earnings releases.
YoYYoY means Year-over-Year. It compares the latest annual value with the previous annual value to show long-term trend strength.
QoQQoQ means Quarter-over-Quarter. It compares the latest quarter with the immediately previous quarter to show short-term momentum changes.
RevenueThe total money that came through the front door from selling things, before paying a single bill. Think of it as the grand total of every credit card swipe from customers. (YoY compares this year to last year's performance, while QoQ compares the current three months to the previous three).
$436.2M
-4.7%
-1.0%
Net IncomeThe absolute bottom line. If the company paid every single supplier, employee, banker, and tax collector, this is the actual money left in their pocket at the end of the day.
$71.4M
-2.0%
+5.4%
Gross MarginThe basic markup. If they sell a $100 pair of sneakers, this percentage tells you how much of that price tag is profit right after paying for the rubber and shoelaces, but before paying for things like store rent or TV commercials.
+61.1%
-3.5%
+2.5%
Operating MarginThe 'day job' efficiency score. Out of every dollar a customer spends, this shows how many cents the company keeps after making the product AND paying for all the everyday corporate overhead (like salaries, marketing, and keeping the lights on).
+33.5%
+18.6%
+2.8%
Net MarginThe final take-home percentage. When you strip away every conceivable cost, tax, and interest payment, this is the exact number of cents the company truly gets to keep from every dollar in sales.
+16.4%
+2.9%
+6.4%
Free Cash FlowThe holy grail of corporate cash. It's the spendable, physical money left over after the business pays for its daily operations AND buys the big, expensive upgrades (like new factories or servers) it needs to survive. This is the 'free' money they can use to pay dividends or buy back stock.
$94.9M
-30.7%
+34.5%
FCF MarginThe ultimate cash conversion rate. It shows how good the company is at turning regular sales directly into cold, hard, spendable cash. A high percentage means the business is an absolute cash-printing machine.
+21.7%
-27.3%
+35.8%
Debt / EquityThe financial risk gauge. It compares how much of the company's empire was built using borrowed money (loans) versus the owners' own money (shareholders). A high number means they are heavily leveraged and playing a riskier game; a low number means they are playing it safe.
148.3%
-14.2%
+1.9%
Current RatioThe 12-month survival check. It simply compares the cash they have right now (plus things they can quickly turn into cash) against the immediate bills they absolutely must pay this year. A score above 1 means they have enough in the wallet to cover the upcoming bills without panicking.
2.04x
-65.6%
+5601.2%
Total AssetsThe absolute size of the company's empire. It bundles together absolutely everything of value they own—from the cash in the register and the inventory in the warehouse, to the software patents in the vault and the factories on the ground.
Operator: Good morning, and welcome to the American Assets Trust Inc. Second Quarter 2026 Earnings Call. [Operator Instructions] I would now like to turn the call over to Meleana Leaverton, Associate General Counsel of American Assets Trust. Please go ahead.
Meleana Leaverton: Thank you, and good morning. The statements made on this earnings call include forward-looking statements based on current expectations, which statements are subject to risks and uncertainties discussed in the company's filings with the SEC. You are cautioned not to place undue reliance on these forward-looking statements as actual events could cause the company's results to differ materially from these forward-looking statements. Yesterday afternoon, American Assets Trust's earnings release and supplemental information were furnished to the SEC on Form 8-K. Both are now available on the Investors section of its website, americanassetstrust.com. It is now my pleasure to turn the call over to Adam Wyll, President and CEO of American Assets Trust.
Adam Wyll: Good morning, everyone, and thank you for joining us today. At American Assets Trust, we manage our business with patience, discipline and a long-term focus regardless of where we are in the economic cycle, letting the quality of our assets and our platform do the heavy lifting. That consistency has served us well through the first half of 2026 even as economic conditions and capital markets are still uneven. For the second quarter, we generated $0.51 of FFO per diluted share, ahead of our internal expectations. Portfolio-wide same-store cash NOI increased 0.3% or 1.3%, excluding a onetime reserve for an office tenant receivable. At midyear, our current outlook supports the midpoint of our full year FFO guidance range with potential to move into the upper half if several operating variables develop favorably. Bob will discuss those factors and the key moving pieces shortly. The broader economy presents a mixed but generally resilient picture. Growth is solid and unemployment remains low, while hiring has moderated and inflation, although still above target, eased in the latest reading. For commercial real estate, that backdrop supports tenant demand, while transaction activity has become more constructive. Retail and multifamily assets are commanding strong pricing, a favorable read-through to the value of what we own and office transaction activity is picking up, providing greater visibility into the value of our office portfolio. Public real estate markets have strengthened as well with listed REITs outperforming the broader equity market this year on growing investor recognition of durable cash flows, limited new supply and high replacement costs. Still, performance is highly differentiated, and our job is to keep executing, translating leasing progress into commenced rent, cash flow growth and ultimately, a valuation that better reflects the quality of our portfolio. Our balance sheet supports that execution …