%22%2F%3E%0A%20%20%3Ccircle%20cx%3D%22220%22%20cy%3D%22150%22%20r%3D%22180%22%20fill%3D%22%2322d3ee%22%20fill-opacity%3D%220.12%22%2F%3E%0A%20%20%3Ccircle%20cx%3D%221010%22%20cy%3D%22130%22%20r%3D%22220%22%20fill%3D%22%2338bdf8%22%20fill-opacity%3D%220.08%22%2F%3E%0A%20%20%3Ccircle%20cx%3D%22920%22%20cy%3D%22520%22%20r%3D%22170%22%20fill%3D%22%2322d3ee%22%20fill-opacity%3D%220.06%22%2F%3E%0A%20%20%3Cpath%20d%3D%22M140%20430h920%22%20stroke%3D%22url(%23line)%22%20stroke-width%3D%2212%22%20stroke-linecap%3D%22round%22%2F%3E%0A%20%20%3Cpath%20d%3D%22M220%20360c120-150%20260-220%20380-220s260%2070%20380%20220%22%20fill%3D%22none%22%20stroke%3D%22%2367e8f9%22%20stroke-opacity%3D%220.5%22%20stroke-width%3D%2216%22%20stroke-linecap%3D%22round%22%20stroke-linejoin%3D%22round%22%2F%3E%0A%20%20%3Cpath%20d%3D%22M300%20398h600%22%20stroke%3D%22%2394a3b8%22%20stroke-opacity%3D%220.24%22%20stroke-width%3D%228%22%20stroke-linecap%3D%22round%22%2F%3E%0A%20%20%3Ctext%20x%3D%22220%22%20y%3D%22510%22%20fill%3D%22%23e2e8f0%22%20fill-opacity%3D%220.7%22%20font-family%3D%22Arial%2C%20Helvetica%2C%20sans-serif%22%20font-size%3D%2238%22%20letter-spacing%3D%228%22%3EINSIGHTS%3C%2Ftext%3E%0A%3C%2Fsvg%3E)
AAA national average, Labor Day weekend 2026
$4.14/gal
AAA newsroom, Sep 3, 2026 release; up 30% from $3.20 a year earlier
Prior Labor Day record
$3.82/gal
Set Sep 3, 2012 — broken by 32 cents
WTI 3-2-1 crack spread
~$60/bbl
Nearly tripled since January 2026; the refiner's per-barrel gross margin
U.S. refinery utilization
98%
Week ending Aug 28, 2026 — highest since August 2018
Distillate inventory vs. 5-year avg
-14%
EIA WPSR, week ending Aug 28, 2026
Brent crude, Sep 4, 2026
$97.36/bbl
Up 47% year-on-year as U.S.–Iran fighting resumes
The Record Breaks by 32 Cents
AAA reported a national average of $4.1436 per gallon for the Labor Day 2026 weekend, surpassing the prior holiday record of $3.82 set on September 3, 2012 by roughly 32 cents — the first time the holiday benchmark has crossed $4.00. The print matters less as a number than as a signal: retail prices are running about 30% above the same weekend in 2025, when the national average sat near $3.20.
Forbes and CNN both frame the move as a transmission shock from the Iran war that began February 28, 2026, when the U.S. and Israel struck Iranian targets — the original crude-price impulse that pushed Brent above $90 and pulled diesel, in particular, to record territory. Diesel is the linchpin most retail stories miss: CNN flags that the national diesel average is on the verge of surpassing Biden-era highs, a point that hits freight, agriculture and heating bills with more lag than the pump print.
Refineries Are Running Out of Slack
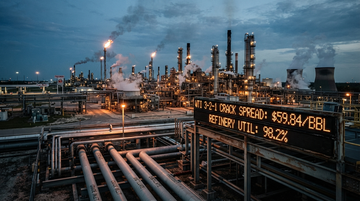
A retail price record is the symptom; refining capacity is the constraint. The EIA's Weekly Petroleum Status Report for the week ending August 28, 2026 shows U.S. refineries processing 17.5 million barrels per day at 98% of operable capacity — the highest utilization since August 2018. Gasoline output averaged 9.8 million b/d, distillate production 5.1 million b/d.
- Gasoline inventories ran 6% below the five-year average, with the four-week average of gasoline product supplied down 2% year-over-year.
- Distillate inventories ran 14% below the five-year average — the tightest read in years and the structural reason diesel is closing on its all-time high.
- Crude imports jumped 612,000 b/d week-over-week to 6.8 million b/d, with the four-week average 2% above a year earlier, evidence that domestic refiners are scavenging barrels globally to keep units fed.
At 98% utilization, the system has almost no mechanical room to add product; any incremental gasoline must come from running harder (impossible), from imports (already pulling), or from a demand collapse (not visible). The squeeze therefore flows straight into refining margins — and the per-barrel crack spread is what refiners actually earn on each barrel of crude they process.
Crack Spreads Near $60 Double Refiner Margins
The WTI 3-2-1 crack spread — two barrels of gasoline plus one barrel of diesel, minus three barrels of crude — has run near $59 to $60 per barrel through August, nearly tripling since the start of 2026. That is the headline that explains the entire downstream profit cycle.
| Company | Q2 net income | Diluted EPS | Refining-margin detail |
|---|---|---|---|
| Marathon Petroleum | $5.14B | $17.68 | R&M margin $36.33/bbl vs. $17.58 a year earlier (2.07x); 112% margin capture in Q2, 108% YTD |
| Phillips 66 | $3.85B | $9.55 | Adjusted EPS $9.41 vs. consensus $7.02; nearly 20× the $207M reported in Q1 2026 |
| Valero | $3.72B | $12.62 | Revenue $36.6B; all-time high Q2 earnings on refining + renewable diesel strength |
| HF Sinclair | Not disclosed | $1.72 (quarterly) | Net income $305M in Q2; benefiting from Mid-Con / Rockies refining tightness |
| PBF Energy | Implied ~$0.8B | $1.74 | Highest pure crack-spread beta in the group; P/E (TTM) of 6.6 reflects skepticism on margin durability |
Marathon Petroleum's Q2 disclosure is the cleanest read on what the crack-spread environment has done to a refiner's P&L: its refining & marketing margin of $36.33 per barrel was more than double the $17.58 of a year earlier, and the company captured 112% of its margin benchmark in the quarter. That is the single most important number in the supply chain this Labor Day — every dollar of margin capture in a 17-million-barrel-day system compounds across roughly 1.5 billion barrels per quarter.
The Money Lands in Capital Returns
Refiners and integrateds are converting the windfall into cash returns at a pace the sector has not seen since the pre-2020 cycle. Marathon Petroleum added a new $5 billion buyback authorization in the quarter, executed $2.5 billion in buybacks, and declared a $1.00-per-share dividend; the midstream MLP it controls (MPLX) is targeting 12.5% annual distribution growth. Phillips 66 has rallied roughly 62% year-to-date on the same dynamics, per a Seeking Alpha downgrade that argues the peak is already in.
The integrateds are bigger beneficiaries of the refining margin than they are usually credited for. ExxonMobil's Q2 2026 earnings release shows Energy Products segment earnings of $5.5 billion in Q2 2026, up from $1.4 billion a year earlier — the segment that houses refining and marketing captured the bulk of the swing that drove the company's $14.5 billion quarterly net income. Exxon returned $23.6 billion in operating cash flow, deployed $6.8 billion in capex, and continues Permian production above 1.8 million oil-equivalent barrels per day. Chevron's Q2 net income of $12.07 billion and $67.2 billion of revenue follow the same pattern, with refining margin the swing factor the market is only beginning to disentangle from upstream pricing.
ExxonMobil Q2 net income
$14.5B
Q2 FY2026, filed Aug 3, 2026; Energy Products $5.5B vs. $1.4B a year earlier
Marathon Petroleum buyback authorization added
$5B
Q2 FY2026 release, Aug 4, 2026; $2.5B executed in the quarter
Refiner YTD returns vs. S&P 500
MPC +85%, VLO +84%, DINO +85%
S&P 500 +11% YTD, per CNBC, Aug 17, 2026
The Trump Demand and Its Limits
On August 3, 2026, the president publicly demanded ExxonMobil and Chevron cut retail gasoline prices, saying they had made \"too much money\" off higher fuel prices and should \"give some of that back to the public\" — with the Reuters account quoting the line \"they better cut the retail price, the consumer price.\" Al Jazeera's same-day story noted the personal attack on Chevron CEO Mike Wirth. The two-day-after-Labor-Day pump record is the answer the market is sending back: the political ask did not move the structural mechanics.
The political mechanic that does bite is the approval rating. The Economist's Trump approval tracker shows the president's net approval on inflation and prices at −44, the lowest reading on that issue of his political career; Reuters/Ipsos has overall approval stuck at 33%. That is the channel through which the September 3 pump print feeds into the November midterm environment — not through any direct price-cut mechanism, but through the political price Trump is paying at the ballot box for the $1.00-a-gallon year-over-year move.
The Supply Chain Map — Who Eats the Margin
| Layer | Listed names | What's happening | Margin capture |
|---|---|---|---|
| Upstream E&P (pure crude price exposure) | EOG Resources, Occidental, ConocoPhillips | Crude up ~47% YoY; Permian and DJ Basin barrels reprice monthly | Price taker on crude; cost-of-production discipline still drives returns |
| Integrated Upstream + Downstream | ExxonMobil, Chevron | Capture both crude price AND refining margin — Q2 Energy Products $5.5B (XOM) | Highest total-cycle margin; political risk overlays the equity |
| Independent refining (pure crack) | Marathon Petroleum, Valero, Phillips 66, HF Sinclair, PBF Energy | WTI 3-2-1 ~$60/bbl; 98% utilization; MPC R&M $36.33/bbl (2x YoY) | Biggest dollar margin gainers; capital returns accelerating |
| Midstream / distribution | Energy Transfer, Sunoco | Volume support from high utilization; pipeline tariffs adjust on inflation | Stable cash flow; less direct leverage to crack spread |
| Retail (gas-station) | Murphy USA, Casey's | Pump price draws foot traffic; fuel contribution per gallon +27% YoY at MUSA | Mixed — traffic up, but consumer trade-down risk on essentials |
The map clarifies why refining is the dominant equity story even though it is a smaller revenue pool than upstream: every barrel of crude that the integrateds lift at $90 is sold into a refining system that is converting it at $60/bbl of margin — that second conversion is where Marathon Petroleum, Valero and Phillips 66 are printing the buyback-funded cash. It is also why PBF Energy, the highest-beta pure-play on the 3-2-1 crack, trades at a TTM P/E of 6.6 — the market is pricing the cycle as mean-reverting, not permanent.
What Could Move the Pump Before November
- An Iran ceasefire that holds is the single biggest short-term downside catalyst — Al Jazeera documents that oil returned to pre-war levels after the June 2026 framework deal; a durable second agreement would compress crack spreads and the refining margin capture that has doubled Marathon Petroleum's per-barrel economics.
- U.S. distillate inventory rebuild is the bottleneck that the market is not pricing: at 14% below the five-year average, even a normal seasonal demand step-down (post-Labor Day) cannot rebuild barrels fast enough to ease diesel ahead of the heating-oil draw.
- Trump's political pressure is bounded by structure, not by will — the integrateds do not own the U.S. retail gasoline channel, the independents do, and any cut at the wholesale level would flow to the independents first.
The horizon distinction matters: the next 60 days are a political window in which the consumer price will dominate headlines and independents will keep collecting crack-spread cash; over one to three years, the structural answer is capacity additions that the industry has not committed to at scale and that distillate tightness will not allow until refining capex accelerates meaningfully.
Listed names tied to the $4.14 pump
- Q2 R&M margin of $36.33/bbl doubled the $17.58 a year earlier and captured 112% of the 3-2-1 benchmark — pure crack-spread leverage
- Added a fresh $5B buyback authorization, executed $2.5B in Q2, and paid a $1.00/share dividend; Q2 EPS $17.68 beat consensus $14.52 by 22%
- Through-cycle risk: a sustained Iran ceasefire could compress the crack toward $30/bbl within one quarter and reset 2027 estimates
- Capital-return pace is the cleanest cash-flow story among independents — 112% margin capture + 94% utilization = record free cash
- Q2 2026 net income $3.72B and EPS $12.62 — the highest in the company's history on the same WTI 3-2-1 spread
- Renewable diesel margin contribution is layered on top of conventional refining, giving Valero a cleaner-LCO2 angle as diesel prices stay firm
- Forward P/E of 13.8 versus trailing 15.5 — the market is giving Valero the cleanest through-cycle multiple in the group
- Risk: PBF-style mean-reversion pricing if crude falls; 98% U.S. utilization has no more upside to unlock
- Q2 2026 net income $3.85B was ~20× the $207M reported in Q1 2026 — the steepest sequential ramp in refining
- Stock has rallied ~62% YTD, and a Seeking Alpha double-downgrade to Sell flags that the refining peak may be priced in
- Refining + Marketing + Renewables captured $450M of favorable mark-to-market in the quarter — paper gains, not all cash
- Watch the Q3 release for signs that 3-2-1 crack has begun to roll over; that will determine whether 62% YTD is a peak or a base
- Energy Products segment earnings of $5.5B in Q2 vs. $1.4B a year earlier — refining margin is doing more work than crude price
- Operating cash flow $23.6B in a single quarter funds dividend, buyback and Permian capex without leverage stress
- Trump's Aug 3 pressure is targeted here first, but XOM does not set U.S. retail prices — political risk is narrative, not fundamental
- Through 2027, the integrated model captures both crude and crack — best-positioned if distillate tightness persists
- CEO Mike Wirth was personally attacked in Trump's Aug 3 demands — the most direct political exposure in the integrated cohort
- Q2 net income $12.07B and EPS $6.13 still set records, but the political overhang compresses the multiple XOM trades at
- Lower Permian weighting vs. XOM and reliance on Tengiz means less direct U.S. gasoline narrative — easier political target despite less retail exposure
- Risk to thesis: an executive-order-style intervention is low-probability but not zero; CVX is the equity with the most election-cycle headline risk
- Q2 2026 total fuel contribution of 40.6 cents per gallon, up from 32 cpg a year earlier — 27% higher retail margin on every gallon sold
- Retail gallons +3.9% YoY and same-store volumes +0.5% — high prices are not crushing volumes at the pump
- Management's H2 2026 outlook assumes only 35 cpg fuel margin, intentionally excluding any upside from Iran-driven crack spreads
- Long-term: 45–55 new-store openings per year compounds the per-gallon economics into a durable, capital-light retail growth story
- Pure E&P with the lowest-cost shale position — captures the full Brent move to $97 without refining-margin concentration
- TTM P/E of 11.3 is the cheapest among major U.S. E&Ps; capital-return policy intact even as crude backs up
- Returns on capital above 22% through-cycle; the simplest way to play crude price upside without refining cyclicality
- Risk: a sustained Iran ceasefire would compress crude to $75–$80 within a quarter and reset estimates by ~15%
- TTM P/E of 6.6 — the market is pricing crack-spread mean reversion, which is the single biggest bear case for refiners
- Q2 revenue growth of 56.2% YoY confirms margin capture; the question is whether PBF is the cleanest crack-spread hedge or the most exposed name
- Insider ownership of 14.3% aligns management with shareholders through the cycle
- Mixed because the same leverage that has tripled margins in 2026 reverses fastest if global refining capacity normalizes