%22%2F%3E%0A%20%20%3Ccircle%20cx%3D%22220%22%20cy%3D%22150%22%20r%3D%22180%22%20fill%3D%22%2322d3ee%22%20fill-opacity%3D%220.12%22%2F%3E%0A%20%20%3Ccircle%20cx%3D%221010%22%20cy%3D%22130%22%20r%3D%22220%22%20fill%3D%22%2338bdf8%22%20fill-opacity%3D%220.08%22%2F%3E%0A%20%20%3Ccircle%20cx%3D%22920%22%20cy%3D%22520%22%20r%3D%22170%22%20fill%3D%22%2322d3ee%22%20fill-opacity%3D%220.06%22%2F%3E%0A%20%20%3Cpath%20d%3D%22M140%20430h920%22%20stroke%3D%22url(%23line)%22%20stroke-width%3D%2212%22%20stroke-linecap%3D%22round%22%2F%3E%0A%20%20%3Cpath%20d%3D%22M220%20360c120-150%20260-220%20380-220s260%2070%20380%20220%22%20fill%3D%22none%22%20stroke%3D%22%2367e8f9%22%20stroke-opacity%3D%220.5%22%20stroke-width%3D%2216%22%20stroke-linecap%3D%22round%22%20stroke-linejoin%3D%22round%22%2F%3E%0A%20%20%3Cpath%20d%3D%22M300%20398h600%22%20stroke%3D%22%2394a3b8%22%20stroke-opacity%3D%220.24%22%20stroke-width%3D%228%22%20stroke-linecap%3D%22round%22%2F%3E%0A%20%20%3Ctext%20x%3D%22220%22%20y%3D%22510%22%20fill%3D%22%23e2e8f0%22%20fill-opacity%3D%220.7%22%20font-family%3D%22Arial%2C%20Helvetica%2C%20sans-serif%22%20font-size%3D%2238%22%20letter-spacing%3D%228%22%3EINSIGHTS%3C%2Ftext%3E%0A%3C%2Fsvg%3E)
Industrials • Shipping & Logistics
The rally is real—but the pricing engine looks like fear plus vessel scarcity, not a structural demand step-up
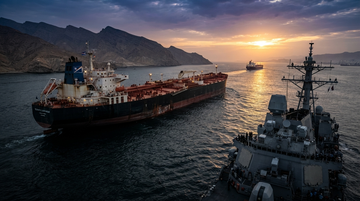
CNBC’s Sept. 3, 2026 read is that shipping stocks have reached “highest levels in more than a decade,” with a basket of 35 U.S.- and European-listed names up about 68% this year and 82% over 12 months—roughly five times the S&P 500’s gain. The immediate catalyst is the Strait of Hormuz disruption tied to the Iran conflict, which has tightened effective tanker supply (longer routes, higher costs, constrained transits) while global energy flows continue.
Basket performance
+68% YTD
Basket of 35 U.S.- and European-listed shipping stocks, as reported by CNBC (as of Sept. 3, 2026)
Basket performance (12 months)
+82%
Same basket, as reported by CNBC (as of Sept. 3, 2026)
Crude-tanker segment leadership
+120% YTD
Crude-tanker stocks, as reported by CNBC (as of Sept. 3, 2026)
ETF surge since February
+650%
Breakwave Tanker Shipping ETF (BWET): since the Middle East war began in February, as reported by CNBC (as of Sept. 3, 2026)
ETF surge (year-to-date)
+2,300%
Breakwave Tanker Shipping ETF (BWET): as reported by CNBC (as of Sept. 3, 2026)
How much of the upside is Hormuz war premium?
A practical decomposition: what likely scales with de-escalation (war premium) vs. what can persist (contracting/real utilization)
CNBC’s key behavioral tell is that tankers and the tanker-freight proxy (BWET) moved far more than broad benchmarks—especially the ETF, which is designed to track crude-tanker forward freight exposure. That pattern is consistent with a market that reprices risk fast (war insurance, route choices, willingness to transit) while real cargo volumes adjust more slowly.
- War premium likely dominates the initial leg because it expresses itself in faster moves in risk-sensitive forward freight exposures (illustrated by BWET’s February jump).
- Freight-cycle tightening (utilization, charter mix, vessel positioning) becomes visible in financial statements as higher TCE revenues and daily TCE rates, but it may lag the fear move.
- De-escalation is a two-speed event: sentiment and war-risk costs can normalize ahead of physical capacity reallocation; that timing mismatch is where fade risk lives.
Evidence in numbers
Where the fundamentals show up: crude-product economics and segment mix in International Seaways and tanker exposure in Teekay Tankers
To separate “price that can disappear” from “earnings that were earned,” look at how quickly companies convert the environment into reported charter economics. In Q2 2026, International Seaways shows sharply higher TCE economics versus the prior year across both crude tankers and product carriers—consistent with a real tightening in effective freight availability.
INSW — Crude Tankers
$253.4M
TCE revenues, three months ended Jun 30, 2026 (10-Q filed Aug 10, 2026)
INSW — Crude Tankers
$108,927/day
Average daily TCE rate, three months ended Jun 30, 2026 (10-Q filed Aug 10, 2026)
INSW — Product Carriers
$180.8M
TCE revenues, three months ended Jun 30, 2026 (10-Q filed Aug 10, 2026)
INSW — Product Carriers
$56,226/day
Average daily TCE rate, three months ended Jun 30, 2026 (10-Q filed Aug 10, 2026)
TNK — Net income (context)
$351.2M
GAAP net income for FY2025 (20-F filed Mar 13, 2026)
In Teekay Tankers, the most direct “cycle map” is how market volatility transmits into the company’s cash economics through TCE rates and charter mix. Its FY2025 disclosure includes average TCE per revenue day and highlights volatility risk from changes in utilization and TCE rates.
| Company | Time period | Metric | Reported value | What this implies for the Hormuz premium vs. cycle |
|---|---|---|---|---|
| International Seaways | Q2 2026 | Crude Tankers TCE revenues | $253,364k | Higher TCE suggests tightened effective supply; fade risk rises if war-risk normalization happens faster than re-contracting. |
| International Seaways | Q2 2026 | Crude Tankers avg daily TCE | $108,927/day | Daily rates embed route/insurance-driven scarcity; de-escalation can compress this quickly. |
| International Seaways | Q2 2026 | Product Carriers TCE revenues | $180,823k | Mixed segment exposure means upside can persist if product routes remain structurally longer. |
| International Seaways | Q2 2026 | Product Carriers avg daily TCE | $56,226/day | If war premium falls, product rates may reprice faster unless charters are fixed-rate/hedged. |
Which names survive when the trade fades?
Survivors share one trait: they can keep earnings power when the risk premium compresses faster than spot rates
Using only what’s verifiable here, the core “survive vs. fade” screening lens is: (1) how much earnings sensitivity sits in spot/short-duration exposure, (2) how quickly daily TCE compresses once the environment normalizes, and (3) whether management already frames the business as cyclically volatile (and therefore not structurally immune to a fade).
- Tanker equities looked like they were pricing a large risk premium because BWET (forward-freight proxy) surged far more than broad indices (CNBC).
- Where reported TCE economics are already elevated (e.g., International Seaways in Q2 2026), the next test is whether contracts carry that strength into later quarters.
- Dry-bulk can participate in the same “geopolitical + scarcity” window, but it doesn’t necessarily share identical insurance/route mechanics; survival depends on charter mix and utilization persistence (illustrated by Safe Bulkers filing showing many charter-rate terms across Panamax/Kamsarmax/Post-Panamax/Capesize).
Investor playbook
Price fade triggers and what to watch next (days-to-quarters vs. 1–3 years)
Based on CNBC’s own framing, the fade trigger is de-escalation: “the moment Hormuz looks normal again.” Investors should therefore monitor (a) insurance and war-risk cost proxies, (b) route behavior and transit willingness, and (c) whether reported TCE and realized charter economics start to decelerate faster than equity prices.
Fast repricing risk: how the ETF signal suggests sentiment led fundamentals
CNBC’s reported performance shows a large move in a tanker forward-freight proxy—consistent with a war-premium-driven repricing leg that can unwind quickly after de-escalation.
Unit: % (as reported)
Breakwave Tanker Shipping ETF (BWET) since February
650%
Breakwave Tanker Shipping ETF (BWET) year-to-date
2300%
Crude-tanker stocks year-to-date
120%
35-stock basket year-to-date
68%
| Trigger | What moves first (days–quarters) | What moves second (1–3 years) | Most directly exposed examples here |
|---|---|---|---|
| De-escalation signals (Hormuz looks “normal”) | Forward freight expectations and war-risk sentiment | Contract roll timing and fleet deployment adjustments | Tanker-freight proxy behavior implied by BWET’s surge (CNBC); realized TCE shown by International Seaways in Q2 2026 |
| Insurance/risk cost normalization | Charter willingness for riskier routes and pricing of war-risk surcharges | Longer-term capex/fleet strategy (if sustained) | Dry-bulk vs. tanker differences in how route risk transmits (compare Safe Bulkers charter terms with tanker TCE reporting in International Seaways) |
| Utilization/cycle tightening continuing without war renewal | Reported TCE and margins hold up | Earnings power stabilizes and valuation rerates from “fear” toward normalized cycle | Teekay Tankers cycle/volatility framing tied to TCE and spot exposure in its FY2025 disclosure |
Listed shipping names most plausibly tied to the Hormuz premium vs. the underlying freight cycle
- FY2025 shows net income of $351.186M, implying meaningful earnings capture, but Teekay Tankers also discloses spot-market volatility as a primary cash-flow swing factor (FY2025 20-F).
- TNK’s reported FY2025 TCE setup (avg TCE per revenue day $39,018) suggests cycle strength, yet that lever can compress if Hormuz normalization reduces route scarcity (FY2025 20-F).
- TNK benefits if higher TCE carries into later quarters, but it fades faster when forward TCE reprices ahead of reported results (de-escalation timing implied by CNBC’s fear-premium quote).
- INSW reported Q2 2026 Crude Tankers TCE revenues of $253.364M and avg daily TCE of $108,927—evidence the environment is monetizing into earnings power (Q2 2026 10-Q).
- Q2 2026 Product Carriers also rose to $180.823M TCE revenues and $56,226/day avg daily TCE, meaning the company isn’t dependent on a single niche (Q2 2026 10-Q).
- INSW can keep cash flows resilient if charter mix sustains utilization while the war-premium component unwinds (gap-risk to monitor via next TCE disclosures).
- SB’s filings include detailed charter-rate terms across dry-bulk vessel classes, so earnings sensitivity can differ sharply by vessel and charter type (SB 6-K dated Jul 29, 2026).
- Dry-bulk’s linkage to Hormuz is less direct than tankers; survival depends on whether geopolitical scarcity translates into persistent dry-bulk utilization rather than only sentiment (inferred from its charter structure in the filing).
- SB is a “watch” on whether dry-bulk holds rates after fear normalizes—no explicit war-premium mechanics were established in the extracted SB disclosure.
- BWLP is a liquid-gas shipping specialist (LPG VLGC fleet exposure), which can respond to disrupted routing and risk pricing differently than crude/product tankers (company overview).
- In this research run, extracted BWLP SEC material did not provide load-bearing war-risk/TCE numbers comparable to INSW’s Q2 2026 TCE tables, so the share survival test can’t be quantified yet (BWLP filings opened did not yield usable rate metrics).
- BWLP is best evaluated on the next reported quarter’s TCE and realized risk cost transmission after Hormuz sentiment shifts.