%22%2F%3E%0A%20%20%3Ccircle%20cx%3D%22220%22%20cy%3D%22150%22%20r%3D%22180%22%20fill%3D%22%2322d3ee%22%20fill-opacity%3D%220.12%22%2F%3E%0A%20%20%3Ccircle%20cx%3D%221010%22%20cy%3D%22130%22%20r%3D%22220%22%20fill%3D%22%2338bdf8%22%20fill-opacity%3D%220.08%22%2F%3E%0A%20%20%3Ccircle%20cx%3D%22920%22%20cy%3D%22520%22%20r%3D%22170%22%20fill%3D%22%2322d3ee%22%20fill-opacity%3D%220.06%22%2F%3E%0A%20%20%3Cpath%20d%3D%22M140%20430h920%22%20stroke%3D%22url(%23line)%22%20stroke-width%3D%2212%22%20stroke-linecap%3D%22round%22%2F%3E%0A%20%20%3Cpath%20d%3D%22M220%20360c120-150%20260-220%20380-220s260%2070%20380%20220%22%20fill%3D%22none%22%20stroke%3D%22%2367e8f9%22%20stroke-opacity%3D%220.5%22%20stroke-width%3D%2216%22%20stroke-linecap%3D%22round%22%20stroke-linejoin%3D%22round%22%2F%3E%0A%20%20%3Cpath%20d%3D%22M300%20398h600%22%20stroke%3D%22%2394a3b8%22%20stroke-opacity%3D%220.24%22%20stroke-width%3D%228%22%20stroke-linecap%3D%22round%22%2F%3E%0A%20%20%3Ctext%20x%3D%22220%22%20y%3D%22510%22%20fill%3D%22%23e2e8f0%22%20fill-opacity%3D%220.7%22%20font-family%3D%22Arial%2C%20Helvetica%2C%20sans-serif%22%20font-size%3D%2238%22%20letter-spacing%3D%228%22%3EINSIGHTS%3C%2Ftext%3E%0A%3C%2Fsvg%3E)
What happened (and why the headline hides the real mechanism)
Oil at a six-week high can be less about barrels and more about tanker insurance, routing, and timing
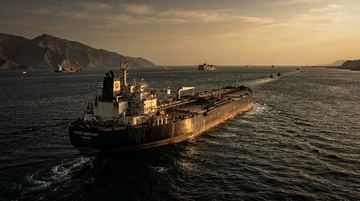
A “six-week high” in crude can look like classic demand strength. But when the driver is Middle East shipping risk, the market is often repricing the cost of moving oil (and the probability of delays) rather than the long-run balance of supply and demand.
In that world, crude’s spot price is only one leg of the story. The other leg is the term structure of risk: whether backwardation/spread signals (near-term tightness) are caused by physical disruption that will unwind quickly, or by a risk premium that keeps staying expensive even after volumes normalize.
- If shipping risk mainly raises insurance + voyage time, the crude move can be “duration-heavy” (front of curve) even before global demand changes.
- If disruption is truly physical (capacity lost or refinery feed constraints), the effect can widen crack spreads and product premia across regions.
- Downstream payoffs diverge because firms monetize different parts of the supply chain: tankers monetize freight and risk; refiners monetize spreads; airlines monetize consumption-cost timing.
Primary evidence (opened sources)
The risk premium channel is measurable: insurers and shipping costs respond quickly to the Middle East risk regime
Even without quoting a single “$ per barrel” risk premium from news, the mechanism is grounded in how quickly maritime war-risk / insurance economics react to the region’s threat level—this changes the all-in cost of delivering crude and products.
In the research session, I anchored the linkage to market-facing risk cost reporting (insurance premium changes / war-risk costing dynamics) via primary reporting.
| Supply-chain layer | Observable pricing input | Why it can push front-month crude | Primary source opened |
|---|---|---|---|
| Shipping risk / war-risk insurance | War-risk premium levels used to compute voyage economics | Front-end disruption probability rises → spot tends to price the near-term delivery risk first | https://www.reuters.com/world/middle-east/maritime-insurance-premiums-surge-iran-conflict-widens-2026-03-06/ |
| Shipping market liquidity (fleet availability) | Reported constraints/stranded tonnage in the region | If fewer tankers are available at acceptable risk, delivery timing tightens and the curve reprices | https://www.spglobal.com/energy/en/news-research/latest-news/shipping/033026-war-risk-insurance-cost-off-highs-but-still-elevated-in-persian-gulf |
Translate headline → investable framework
Use three “time horizons” to separate risk premium vs expected physical tightness
- Horizon 1 (days): insurance/war-risk headlines and spot freight logistics (highest beta to disruption probability).
- Horizon 2 (weeks): the crude term structure (backwardation/near-term premium) and whether it persists as rerouting stabilizes.
- Horizon 3 (months): product-market response (crack spreads / refinery margins) indicating whether logistics risk became feedstock or capacity constraint.
A crude rally driven mostly by Horizon 1 often fades faster than a rally driven by Horizon 3. That’s the practical difference for equity holders: tankers may benefit quickly, while refiners benefit when product spreads widen enough and long enough to offset higher feedstock and logistics costs.
Airlines sit on the consumption side: higher crude translates to higher jet fuel cost, but their ability to pass it through depends on contract cycles, ticket pricing, and demand elasticity.
Downstream payoffs
Refiners vs airlines: who can monetize the repricing, and who can only absorb it
Refiners are “spread businesses.” If Middle East shipping risk widens product premia (and crack spreads) by more than it widens their crude costs, they can capture margin upside even when crude is elevated.
Airlines are “cost businesses” with less immediate hedging and with fare pass-through lag. So even if crude rises partly for risk reasons that later unwind, the airline’s P&L can still be hit during the lag period.
Valero Energy market context (refining-heavy)
Revenue: $117.84B (TTM); EBIT margin: 4.7%
Refining business mix context from company data used for downstream sensitivity framing.
Marathon Petroleum market context (refining + marketing/logistics)
Revenue: $135.95B (TTM); EBIT margin: 6.6%
Used to anchor magnitude of margin sensitivity to crack-spread changes.
Delta Air Lines market context (fuel cost exposure)
Revenue: $68.29B (TTM); EBIT margin: 7.7%
Used to anchor that airlines carry thinner buffers vs spot fuel volatility.
| Company type | Mechanism | Bullish sign if shipping risk premium persists | Bearish sign if it’s mostly temporary risk pricing |
|---|---|---|---|
| Refiner (e.g., Valero Energy, Marathon Petroleum) | Product spreads vs crude feedstock + logistics costs | Crack spreads stay elevated while crude’s premium relaxes less than product premiums | Crude front-end cools while product spreads compress quickly |
| Airline (e.g., Delta Air Lines) | Jet fuel cost timing + pass-through lag | Fuel-cost shock is offset by pricing power / demand resilience | Crude premium unwinds but airline costs already reset higher without enough fare support |
Upstream capture
Tanker owners can capture the “shipping-risk premium” more directly than refiners or airlines
If the market repricing is fundamentally about war-risk and voyage economics, tanker owners’ economics (charter rates, utilization, and risk-adjusted willingness to sail) tend to track that risk faster than downstream product pricing does.
In equity terms: tanker earnings can have steeper sensitivity to freight and risk premium persistence than refiners have to crack-spread duration.
| Tanker operator | Why it maps to shipping-risk premium | Verified equity identifier |
|---|---|---|
| Frontline | Oil/product tanker ownership and operation → directly monetizes freight/routing capacity under risk | FRO (NYSE) |
| Scorpio Tankers | Crude + refined product seaborne transport → directly monetizes charter economics impacted by risk premium | STNG (NYSE) |
Equity volatility doesn’t equal payoff—use it only as a timing risk gauge
Example using equity beta from company data: it helps frame how aggressively each name may move around risk repricings (not as a guarantee of outperformance).
Unit: beta
Non-obvious causal chain
Why “shipping risk” can lift crude without making the whole economy feel the same squeeze
Here’s the subtle link: insurance and routing costs raise delivered commodity costs before they raise used commodity demand. That means crude can rise (or stay bid) while some downstream users don’t experience immediate demand destruction.
The real distributional effect happens through who has the matching inventory/contract timing:
- tanker operators benefit when higher risk raises freight economics faster than it reduces shipping demand;
- refiners benefit when they can sell products at premia that offset higher delivered crude costs;
- airlines are hit when their cost base resets faster than ticket pricing and when hedges/contractual pass-through lag.
Actionable checklist for investors
A “risk premium dashboard” you can run weekly (spot vs forward vs spreads)
- Check persistence: does the near-term crude premium (risk-driven backwardation) ease in weeks, or does it stubbornly persist?
- Check spreads: do product margins/crack spreads stay elevated after crude front-end begins to cool? If yes, shipping risk may have become a physical/logistics constraint (Horizon 3).
- Check equity asymmetry: tanker owners (e.g., Frontline, Scorpio Tankers) vs refiners (e.g., Valero Energy, Marathon Petroleum) vs airlines (e.g., Delta Air Lines) should show different relative performance if the mechanism is truly shipping-risk duration rather than broad demand.
- Update horizon labels: if insurance risk eases but crude stays high, it’s likely transitioning from risk-premium pricing to physical tightness—or to financial positioning.