%22%2F%3E%0A%20%20%3Ccircle%20cx%3D%22220%22%20cy%3D%22150%22%20r%3D%22180%22%20fill%3D%22%2322d3ee%22%20fill-opacity%3D%220.12%22%2F%3E%0A%20%20%3Ccircle%20cx%3D%221010%22%20cy%3D%22130%22%20r%3D%22220%22%20fill%3D%22%2338bdf8%22%20fill-opacity%3D%220.08%22%2F%3E%0A%20%20%3Ccircle%20cx%3D%22920%22%20cy%3D%22520%22%20r%3D%22170%22%20fill%3D%22%2322d3ee%22%20fill-opacity%3D%220.06%22%2F%3E%0A%20%20%3Cpath%20d%3D%22M140%20430h920%22%20stroke%3D%22url(%23line)%22%20stroke-width%3D%2212%22%20stroke-linecap%3D%22round%22%2F%3E%0A%20%20%3Cpath%20d%3D%22M220%20360c120-150%20260-220%20380-220s260%2070%20380%20220%22%20fill%3D%22none%22%20stroke%3D%22%2367e8f9%22%20stroke-opacity%3D%220.5%22%20stroke-width%3D%2216%22%20stroke-linecap%3D%22round%22%20stroke-linejoin%3D%22round%22%2F%3E%0A%20%20%3Cpath%20d%3D%22M300%20398h600%22%20stroke%3D%22%2394a3b8%22%20stroke-opacity%3D%220.24%22%20stroke-width%3D%228%22%20stroke-linecap%3D%22round%22%2F%3E%0A%20%20%3Ctext%20x%3D%22220%22%20y%3D%22510%22%20fill%3D%22%23e2e8f0%22%20fill-opacity%3D%220.7%22%20font-family%3D%22Arial%2C%20Helvetica%2C%20sans-serif%22%20font-size%3D%2238%22%20letter-spacing%3D%228%22%3EINSIGHTS%3C%2Ftext%3E%0A%3C%2Fsvg%3E)
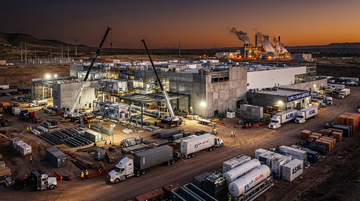
Supply-chain + policy tradeoffs (tariffs, industrial construction, and time-to-capacity)
A new $20B signal points to the same destination: U.S. fab + factory capacity funded by Asian electronics
Taiwan’s government disclosed plans for companies to pursue an additional $20B in U.S. investment, framed in the context of tariff-driven supply-chain restructuring for advanced manufacturing. Reuters’ reporting connects the broader Taiwan–U.S. trade framework to company-led investment decisions, with the U.S. seeking to raise domestic capacity in semiconductors and adjacent high-tech categories.
The key implication for investors: the money follows the constraint—equipment-qualified fabs and packaging/assembly sites—not marketing labels like “Made in USA.”
Taiwan–U.S. investment framework (semis/adjacent)
$250B
Reuters, Jan 15, 2026: Taiwan said companies would invest $250B in the U.S.; Reuters described it as including $100B already committed by TSMC in 2025
Incremental credit to facilitate investment
$250B
Reuters, Jan 15, 2026: the U.S. said it would guarantee additional $250B of credit to facilitate further investment
Incremental U.S. semiconductor investment (reported by U.S. Commerce)
$100B
U.S. Commerce press release, Jul 16, 2026: said an additional $100B would bring TSMC’s total planned U.S. investment to $265B
Why tariffs bifurcate the trade
Tariffs don’t reshuffle everything evenly—they re-route only what can clear “time-to-qualify” and “time-to-build”
Reshoring stories often assume a simple geographic swap. In reality, tariffs compress margins but don’t change engineering reality: qualification cycles, facility lead times, and specialized procurement create a “capacity moat” that favors suppliers already embedded in the electronics buildout ecosystem.
That’s why the Taiwan-linked investment pattern maps most cleanly onto sectors that must expand alongside leading-edge semiconductor fabs:
- Upstream process tools, vacuum/wafer handling, and industrial chemicals/gases (where uptime and specification control order flow), and
- Downstream EMS + system integration (where relocation is primarily an assembly-network and logistics-network redesign).
This is the bifurcation mechanism: tariff pressure increases the value of local capacity, but only actors with the right tooling + qualification track record can supply it fast enough.
Ecosystem mapping (fab/EMS buildout, not headlines)
The likely supply-chain winners sit in the “buildout conveyor belt”: tools and materials first, EMS/thermal integration second
- Process-tool and thin-film deposition equipment beneficiaries tend to see order visibility lift when leading-edge fabs add capacity, because tool installs precede wafer starts.
- Industrial gases suppliers benefit indirectly but materially: new or expanded fabs increase steady demand for high-purity gases and related infrastructure.
- EMS/contract electronics assemblers can win when new U.S. production sites require localized assembly, testing, and enclosure/thermal integration—especially for AI server and networking hardware.
Using listed proxies to ground “buildout conveyor belt” logic:
- Applied Materials and Lam Research represent the upstream process-tool channel (deposition/etch plus related capacity enablement).
- Linde represents industrial gases and facility-linked infrastructure demand.
- Taiwan-focused assembly/interconnect beneficiaries appear in the downstream channel via Pegatron, alongside Taiwanese integration peers like Foxconn and Compal (not all used in the quantitative table below, but relevant as EMS ecosystem anchors).
The thesis is not that every relocation deal flows 1:1 into a single supplier. It is that capacity relocation creates a predictable sequencing of expenditures and qualified installs, which concentrates near-term spend upstream before downstream revenue fully shows up.
| Issuer | Latest disclosed/TTM financial intensity used as a buildout proxy | What it signals for relocation sequencing |
|---|---|---|
| Taiwan Semiconductor Manufacturing | R&D expense $270.1B (TTM ended Jun 30, 2026; reported via TTM statement), gross margin reflected in TTM revenue disclosures | Heavy ongoing engineering and capex-intensive model implies tool + materials demand runs ahead of end-market revenue realization |
| Applied Materials | TTM valuation intensity: EV-to-sales 11.39x (TTM) | Tool demand tends to behave more like a capex-enabler than a purely end-demand proxy |
| Lam Research | TTM valuation intensity: EV-to-sales 15.56x (TTM) | Etch/related process capacity links to leading-edge fab buildouts |
| Linde | TTM valuation intensity: EV-to-sales 7.00x (TTM) | Industrial gases and facility-linked demand can scale with fab/chemical infrastructure expansion |
| Pegatron | TTM profitability/FCF: EV-to-sales 0.60x (TTM), with operating cash conversion reflected in TTM metrics | Downstream EMS upside depends on longer-cycle ramp but can benefit from assembly network redesign |
Where the “$20B” story becomes measurable
How to translate announcements into financial expectations: capex sequencing and order lead times
The most investable part of this trade is timing. Fab buildout money hits supplier balance sheets through tool installation and qualification, not through a single headline.
A practical investor workflow: 1) Treat “capacity relocation” as a capex schedule, not a PR schedule. 2) Identify the “front-end inputs” needed before wafer starts: process tools, cleanroom support systems, high-purity consumables, and gases. 3) Only then expect downstream EMS/thermal/integration revenue ramps once production lines are stable.
In financial terms, that means tools/material enablers often show earlier changes (bookings/lead times reflected in forward-looking margins and valuation support), while EMS reflects later operational normalization.
Fundamentals cross-check (to keep the thesis anchored)
Listed proxies already show the kind of structural profitability and cash generation that can fund “qualification-led” capex demand
TSMC TTM revenue
$4.45T
TTM (fiscal year labeling in financial statement), reported Aug 14, 2026; fiscal period disclosed as TTM
TSMC TTM gross profit
$2.86T
TTM, reported Aug 14, 2026
TSMC TTM R&D
$270.1B
TTM, reported Aug 14, 2026
Applied Materials TTM EV-to-sales
11.39x
TTM, metrics dated 2026-09-02
Lam Research TTM EV-to-sales
15.56x
TTM, metrics dated 2026-09-02
Linde TTM EV-to-sales
7.00x
TTM, metrics dated 2026-09-02
These figures don’t prove the $20B investment will land in any one supplier’s revenue line. But they support the baseline requirement: the ecosystem is capable of sustaining both engineering effort and cash generation to keep the buildout moving.
When policy increases the value of local capacity, these structural characteristics determine which names can ride the buildout sequence.
Short-term vs. long-term horizons
Near-term: bookings and capacity enablement lead; long-term: installed-base and network redesign determine winners
- Next 1–2 quarters: expect market focus on capex scheduling and tool install cadence, which tends to move first in upstream enablers.
- Next 2–8 quarters: watch for clearer evidence of facility ramp (manufacturing utilization) that indicates downstream EMS/assembly ramps can translate into recognizable revenue trends.
- 1–3 years: installed-base effects should dominate. If tariff structures persist, relocation can become sticky, favoring suppliers with qualified U.S. operational track records.
Synthesis thesis
Tariff-driven reshoring is becoming an ecosystem swap—tools/materials win early, EMS wins later
The renewed $20B U.S. investment disclosure reinforces a bifurcating reshoring trade: tariff pressure is driving capacity relocation, but the measurable winners are concentrated where the buildout conveyor belt is strongest.
Upstream, that means process-tool and industrial infrastructure enablers can capture demand as fabs and packaging ecosystems expand. Downstream, EMS and integration names benefit once production is stable enough to support localized assembly and testing.
In short: don’t model this as “U.S. manufacturing headlines.” Model it as tariff-shaped sequencing of qualified capex—and position accordingly across the supply chain.
Listed names most directly tied to the buildout sequence
- Upstream installs tend to front-run wafer starts, so Applied Materials can see earlier demand inflection when fab buildouts accelerate within 1–2 quarters
- Relocation-funded advanced process scaling supports valuation resilience as the market reprices capex-enabler orders
- If qualification schedules slip, tool order timing can wobble even while longer-cycle demand stays intact
- As advanced fab capacity expands, Lam Research can benefit from sustained etch/process demand as tool installs lead ramps over 2–6 quarters
- Larger U.S. leading-edge footprints generally require more processing steps, supporting utilization assumptions in base-case builds
- Trade-policy volatility can affect customer capex pacing, making near-term booking commentary the key indicator
- New and expanded fab footprints increase industrial gases infrastructure demand, so Linde can translate buildout spending into steadier medium-term throughput over 2–4 quarters
- If relocation becomes sticky under tariff regimes, Linde’s facility-linked demand should compound into 1–3 year visibility
- A construction slowdown would delay capacity-related drawdowns while pricing/cost pass-through remains a swing factor
- Downstream EMS ramps are slower, so Pegatron can see delayed upside versus tool/material names over 2–8 quarters
- If AI-server/network buildouts materialize locally, EMS integration can capture incremental localized assembly/testing demand
- If capacity qualification delays occur, cost absorption pressures can outweigh revenue visibility in the near term