%22%2F%3E%0A%20%20%3Ccircle%20cx%3D%22220%22%20cy%3D%22150%22%20r%3D%22180%22%20fill%3D%22%2322d3ee%22%20fill-opacity%3D%220.12%22%2F%3E%0A%20%20%3Ccircle%20cx%3D%221010%22%20cy%3D%22130%22%20r%3D%22220%22%20fill%3D%22%2338bdf8%22%20fill-opacity%3D%220.08%22%2F%3E%0A%20%20%3Ccircle%20cx%3D%22920%22%20cy%3D%22520%22%20r%3D%22170%22%20fill%3D%22%2322d3ee%22%20fill-opacity%3D%220.06%22%2F%3E%0A%20%20%3Cpath%20d%3D%22M140%20430h920%22%20stroke%3D%22url(%23line)%22%20stroke-width%3D%2212%22%20stroke-linecap%3D%22round%22%2F%3E%0A%20%20%3Cpath%20d%3D%22M220%20360c120-150%20260-220%20380-220s260%2070%20380%20220%22%20fill%3D%22none%22%20stroke%3D%22%2367e8f9%22%20stroke-opacity%3D%220.5%22%20stroke-width%3D%2216%22%20stroke-linecap%3D%22round%22%20stroke-linejoin%3D%22round%22%2F%3E%0A%20%20%3Cpath%20d%3D%22M300%20398h600%22%20stroke%3D%22%2394a3b8%22%20stroke-opacity%3D%220.24%22%20stroke-width%3D%228%22%20stroke-linecap%3D%22round%22%2F%3E%0A%20%20%3Ctext%20x%3D%22220%22%20y%3D%22510%22%20fill%3D%22%23e2e8f0%22%20fill-opacity%3D%220.7%22%20font-family%3D%22Arial%2C%20Helvetica%2C%20sans-serif%22%20font-size%3D%2238%22%20letter-spacing%3D%228%22%3EINSIGHTS%3C%2Ftext%3E%0A%3C%2Fsvg%3E)
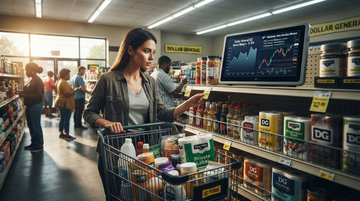
Earnings • Consumer stress test
Dollar General’s Q2 FY2026 treated low-income strain like a signal, not a shutdown
Dollar General’s fiscal second quarter (13 weeks ended July 31, 2026) landed as a live read on the low-income consumer right after the July retail-sales dip that tightened the market’s “hike vs. cut” debate for September. The key question for investors is whether Dollar General’s core customer is trading down because wallets are tighter—or whether distress is already forcing a demand collapse.
In the numbers, the demand signal is there: same-store sales rose 3.5% year over year, and the company attributes the lift to higher traffic alongside higher average transaction amounts. But the earnings quality hinges on cost and margin factors, not just top-line.
Dollar General’s Q2 FY2026 same-store sales rose 3.5% while gross margin expanded 127 bps, which is the combination investors should treat as the “stress-test pass” for now.
Same-store sales
3.5% YoY
Q2 FY2026 (13 weeks ended Jul 31, 2026)
Net sales growth
+5.2%
Q2 FY2026 vs Q2 FY2025
Gross margin
32.6%
Q2 FY2026 vs 31.34% in Q2 FY2025
Operating profit
+29.2%
Q2 FY2026 vs Q2 FY2025
Net income
+33.8%
Q2 FY2026 vs Q2 FY2025
Demand read-through
Trade-down looks like volume and ticket—not a one-off promo spike
A low-income trade-down thesis lives or dies on two components: customer visits (traffic) and basket economics (items per trip vs. price per item). Dollar General’s quarter points to both improving. The company reports that same-store sales rose 3.5%, driven by 2.0% customer traffic and 1.5% average transaction amount.
Importantly for distinguishing “stress” from “panic,” the company indicates that the average transaction amount was driven by higher average retail prices, partially offset by fewer items per transaction—a pattern consistent with consumers trading down and buying less discretionary quantity, not abandoning the channel entirely.
Traffic was up 2.0% in Q2 FY2026, signaling trade-down rather than channel abandonment—but investors should keep watching whether items-per-ticket continues to compress as financing costs and uncertainty change.
Margin mechanics
The earnings resilience is real—but partially funded by margin tailwinds you may not want to over-model
Dollar General’s margin improvement is the centerpiece of the quarter. Gross profit rose 9.5% year over year, and gross margin expanded to 32.6% from 31.34%.
The company’s margin bridge matters for what comes next. It cites gross profit rate drivers such as tariff refunds, a lower LIFO provision, and lower distribution costs—factors that sound controllable only at the margins. Those positive items were described as partially offset by increased markdowns and increased transportation costs.
The net message for investors is simple: the quarter passed the stress test because gross margin expanded while SG&A stayed disciplined (SG&A as a percent of sales was roughly 25.8% in both years). But if tariff refunds reverse or transportation costs re-accelerate, the cushion could shrink quickly.
Gross margin expanded 127 bps in Q2 FY2026, but part of that lift came from items the company calls out as rate drivers—not an ironclad structural trend.
Supply chain & cash flow translation
Working-capital moves hint at inventory and payment timing—watch for demand softness signals
A low-income channel can look fine in earnings while still showing early warning signs in cash conversion. Over the 26-week period ended July 31, 2026, Dollar General reported cash flow from operating activities of $1.5 billion, down $318.2 million year over year.
The 10-Q highlights the direction of working-capital contributions: increases in accounts payable and decreases in merchandise inventories and prepaid expenses can move operating cash around even when revenue is steady. The inventory section also offers a concrete snapshot: inventory represented approximately 42% of total assets (excluding operating lease assets, goodwill, and other intangibles) as of July 31, 2026.
For the trade-down debate, the key question is whether inventory is growing because demand is strong (good) or growing because demand is weakening and products are sitting (bad). Dollar General reports total merchandise inventories increased 3% in the 26-week period (and inventories at the store level were down 2.7% vs. the prior year), with category mix shifts such as consumables +5% and apparel -9%.
Inventories grew 3% over the 26-week period while per-store inventories fell 2.7%, which supports steady demand—not obvious clearance selling—but cash flow still needs to stabilize.
Fed window: hike-or-cut as a consumer-rate proxy
September’s Fed decision matters less for DG’s shopper—and more for the discount-rate on the stock
The macro link isn’t that Dollar General’s customers debate policy meetings. It’s that the Fed window changes two things that can hit DG quickly: (1) the broader economy’s borrowing costs and labor income trajectory, and (2) the equity market’s discount rate for defensive growth.
In the Fed’s late-July minutes, participants explicitly noted that low- and moderate-income households are under increasing strain because inflation is eroding real disposable income, even while higher-income spending appears supported by stock-market gains. That maps tightly to the customer base Dollar General serves.
But for DG’s equity, the other mechanism dominates near-term: if the market reframes September odds toward a hike, the discount rate rises and multiple expansion becomes harder even if DG fundamentals hold.
Fed participants tied low- and moderate-income strain to eroding real disposable income, aligning with why DG’s traffic is the key “real economy” read in this window—yet the stock’s valuation can move faster than fundamentals when rates reprices.
What to watch next (short vs. long horizon)
The next two quarters will be about margin durability and whether “items per basket” bottoms
- Monitor gross margin for follow-through—tariff refunds, LIFO, and distribution-cost swings were cited as drivers, so the bar for a second consecutive margin expansion is higher.
- Track whether items per transaction stabilizes; Dollar General flagged compression (fewer items partially offset higher prices), so continued declines would suggest deeper distress.
- Watch operating cash flow and working-capital timing; the 26-week operating cash flow fell despite higher net income.
- Re-check expense discipline; SG&A as a percent of sales held steady, so future upside is less likely if volume cools.
- For the Fed window, listen for guidance tone on consumer demand; a cautious stance can matter more than the current quarter’s beat.
Listed peers and how DG’s quarter can transmit through the discount chain
- DG’s traffic-led same-store sales supports the category’s “necessities” demand; that can lift sentiment for Dollar Tree near-term quarters if both brands resist traffic declines.
- Dollar Tree can benefit if margin dynamics across the dollar-store channel remain resilient; DG’s gross margin expanded to 32.6% in Q2 FY2026.
- If trade-down is about wallet compression, Ross Stores may face less category tailwind than DG because its value mix is more inventory- and price-market dependent.
- DG’s gross-margin expansion to 32.6% can raise expectations for low-end retailers broadly, but if those drivers revert, the multiple support for Ross Stores can weaken.
- A Fed-tightening repricing can hit discretionary categories; DG’s resilience argues the consumer isn’t fully breaking, but a sharper slowdown would show up in Best Buy first.
- Watch for whether “lower basket items” becomes “lower category baskets” across discretionary electronics as the September decision approaches.
- If consumers keep shifting to value formats, TJX can see steadier off-price demand; DG’s traffic +2.0% in Q2 FY2026 is a constructive demand analog.
- DG’s disciplined SG&A ratio (~25.8% of sales) suggests value retailers can keep earnings quality even in stress, supporting a defensive bid for TJX around rate volatility.