%22%2F%3E%0A%20%20%3Ccircle%20cx%3D%22220%22%20cy%3D%22150%22%20r%3D%22180%22%20fill%3D%22%2322d3ee%22%20fill-opacity%3D%220.12%22%2F%3E%0A%20%20%3Ccircle%20cx%3D%221010%22%20cy%3D%22130%22%20r%3D%22220%22%20fill%3D%22%2338bdf8%22%20fill-opacity%3D%220.08%22%2F%3E%0A%20%20%3Ccircle%20cx%3D%22920%22%20cy%3D%22520%22%20r%3D%22170%22%20fill%3D%22%2322d3ee%22%20fill-opacity%3D%220.06%22%2F%3E%0A%20%20%3Cpath%20d%3D%22M140%20430h920%22%20stroke%3D%22url(%23line)%22%20stroke-width%3D%2212%22%20stroke-linecap%3D%22round%22%2F%3E%0A%20%20%3Cpath%20d%3D%22M220%20360c120-150%20260-220%20380-220s260%2070%20380%20220%22%20fill%3D%22none%22%20stroke%3D%22%2367e8f9%22%20stroke-opacity%3D%220.5%22%20stroke-width%3D%2216%22%20stroke-linecap%3D%22round%22%20stroke-linejoin%3D%22round%22%2F%3E%0A%20%20%3Cpath%20d%3D%22M300%20398h600%22%20stroke%3D%22%2394a3b8%22%20stroke-opacity%3D%220.24%22%20stroke-width%3D%228%22%20stroke-linecap%3D%22round%22%2F%3E%0A%20%20%3Ctext%20x%3D%22220%22%20y%3D%22510%22%20fill%3D%22%23e2e8f0%22%20fill-opacity%3D%220.7%22%20font-family%3D%22Arial%2C%20Helvetica%2C%20sans-serif%22%20font-size%3D%2238%22%20letter-spacing%3D%228%22%3EINSIGHTS%3C%2Ftext%3E%0A%3C%2Fsvg%3E)
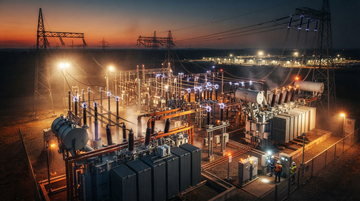
Grid Economics • Congestion Pricing
The $6B figure is a regime change: congestion is becoming the system’s most expensive unpriced constraint
PJM congestion costs surged 43% to $6 billion during the first half of 2026 (January–June), highlighting that the grid’s limiting factor is increasingly transmission constraint time—not just energy supply.
In plain terms, when key lines get overloaded or effectively run short of usable capacity, PJM’s internal pricing mechanisms translate those constraints into settlement charges that show up as a growing line item on top of the normal “how much energy do we need?” question.
PJM congestion costs
$6.0B
First half of 2026 (January–June), reported Aug 21, 2026
Year-over-year change
+43%
First half of 2026 vs. first half of 2025, reported Aug 21, 2026
Real-time wholesale cost level
$72.54
Average real-time price across PJM, first half of 2026
Real-time cost swing
+$20.79
First half of 2026 vs. first half of 2025 (avg. $72.54 vs. $51.75)
What broke—and why it shows up as $6B
Constraints tightened in the exact places where new data-center load is densest
The mechanics are consistent with how PJM’s system behaves under stress: overloads and binding constraints during severe operating conditions create repeated periods where locational value differs materially across the footprint.
The PJM independent market monitor points to thousands of 500-kilovolt line limit violations in the first half of 2026 and ties the burden to constraint-heavy regions, including Northern Virginia (a major data-center cluster) alongside metro Baltimore and Delaware.
- The monitoring analysis reports 500-kilovolt line limit violations at 8,920 five-minute periods in the first half of 2026, versus 1,865 a year earlier.
- The same analysis identifies Northern Virginia as the hardest-hit congestion area, aligning with where large-scale data centers are concentrated.
- The monitoring analysis links the rise in wholesale cost to stress periods where constraints bind, producing larger congestion-related adjustments.
| Metric | First half of 2026 | First half of 2025 | What it signals |
|---|---|---|---|
| 500-kilovolt line limit violations (five-minute periods) | 8,920 | 1,865 | More frequent constraint breaches during stressed operations |
| Average real-time wholesale cost (across PJM) | $72.54/MWh | $51.75/MWh | Higher baseline price pressure when constraints bind |
| Wholesale cost increase vs prior year (avg.) | +$20.79/MWh | — | Larger congestion-linked and constraint-driven adjustments |
Economic transmission bottleneck → who pays
Congestion pricing reshapes PPA math and merchant margins because it behaves like a location-linked tax
Transmission congestion is not evenly distributed. When Northern Virginia or other constraint-heavy zones experience more frequent binding constraints, the economic impact differs by where generation and load connect.
That creates an investor-relevant tension: congestion charges are “market outcomes,” but they ultimately feed back into contract and pricing structures—hurting fixed-price arrangements where the delivery location is constraint-sensitive, while advantaging parties that can hedge location risk or are positioned in less-congested zones.
A crucial nuance from the monitoring analysis: it argues the system can mis-estimate effective capacity availability, which can raise penalties incorrectly during a very large share of instances. Even if the exact magnitude of “mis-estimation” doesn’t change the direction, it increases the odds that congestion costs are both (1) larger and (2) less predictable than planners expect.
Supply chain tie-in: transmission backlog is now demand-driven by price outcomes
This is the missing demand-side quantification for the transformer/HV equipment backlog trade
The grid-equipment story has often been told from the supply side—lead times for transformers, switchgear, and HV components. The new congestion-cost regime adds a different viewpoint: it quantifies the near-term “economic pain” that accompanies delay.
Because congestion costs are rising fast, the urgency signal for build/upgrade decisions intensifies. That accelerates the economic rationale for major transmission work (new lines, conductor upgrades, transformer additions, and constraint relief), even though the hardware timeline still runs through long procurement and commissioning cycles.
- When congestion reaches $6B in H1 2026, it raises the opportunity cost of waiting on constraint relief projects.
- More frequent high-voltage constraint violations imply more “stress-hours,” increasing the expected value of line/transformer relief versus relying on operational workarounds.
- Constraint concentration in data-center-heavy regions increases the probability that upgrades cluster geographically—tightening demand for HV assets where load is densifying.
Short-term vs long-term: what moves next
Short-term: congestion costs can keep compounding until constraint relief catches up; long-term: contracts likely reprice location risk
Short-term, the most immediate driver is operating reality: storms, cold snaps, and any periods that increase overload probability can generate disproportionate congestion charges. The monitoring analysis’ evidence of many more high-voltage limit violations supports that this is not a one-off—it's a repeatable exposure pattern.
Long-term, the structural risk is not “AI load exists,” but whether the interconnection and transmission deliverability envelope keeps pace. As that mismatch persists, location risk becomes more salient in procurement—PJM-area power contracting, congestion pass-through logic, and hedging practices all tend to evolve when congestion behaves like a persistent cost rather than a sporadic anomaly.
Investor lens: what to watch in earnings and guidance
Watch for three signals that confirm the congestion-cost-to-capex feedback loop
- Price pressure stays high when constraints bind—monitor whether wholesale cost metrics and congestion penalties remain elevated quarter after quarter.
- Guidance shifts toward transformer/HV delivery capacity—look for order backlog language tied to transmission expansion and grid reliability.
- Utilities’ capital plans emphasize constraint relief—watch for capex prioritization where congestion is most persistent (constraint-heavy zones).
Because this story is fundamentally grid-wide economics, the most actionable “confirmation” tends to appear in (a) transmission capex plans, (b) grid-equipment order intake and delivery schedules, and (c) risk language in merchant and contracting guidance around location- and congestion-exposure.
Where this $6B congestion regime is likely to show up in listed markets
- Siemens Energy benefits if transmission constraint relief capital accelerates after congestion reaches $6B in H1 2026.
- Order-to-delivery timing favors near-term momentum if HV switchgear and transformers remain on long lead times into 2027.
- Congestion costs become a measurable justification for grid upgrades, so HV equipment demand should strengthen if the $6B pace persists.
- If Northern Virginia-style constraint clustering continues, grid-reliability project pipelines should increasingly target substations and transformer capacity.
- If congestion stays high, utilities tend to prioritize reliability upgrades, so electrical components demand should track transmission buildout urgency.
- Over the next 1–3 years, higher congestion persistence can pull forward replacement and upgrade cycles for protection and power distribution hardware.
- More congestion in constraint-heavy regions can raise the need for transmission capex, potentially supporting earnings if regulators allow recovery.
- But when congestion costs rise, rate base and regulatory timing risk can increase, limiting the speed at which higher capex converts into profit.
- If constraint relief accelerates, NextEra could see better deliverability economics for new generation investment over 1–3 years.
- Near term, congestion-driven settlement volatility can compress realized margins for merchant exposure in constraint-sensitive zones.