%22%2F%3E%0A%20%20%3Ccircle%20cx%3D%22220%22%20cy%3D%22150%22%20r%3D%22180%22%20fill%3D%22%2322d3ee%22%20fill-opacity%3D%220.12%22%2F%3E%0A%20%20%3Ccircle%20cx%3D%221010%22%20cy%3D%22130%22%20r%3D%22220%22%20fill%3D%22%2338bdf8%22%20fill-opacity%3D%220.08%22%2F%3E%0A%20%20%3Ccircle%20cx%3D%22920%22%20cy%3D%22520%22%20r%3D%22170%22%20fill%3D%22%2322d3ee%22%20fill-opacity%3D%220.06%22%2F%3E%0A%20%20%3Cpath%20d%3D%22M140%20430h920%22%20stroke%3D%22url(%23line)%22%20stroke-width%3D%2212%22%20stroke-linecap%3D%22round%22%2F%3E%0A%20%20%3Cpath%20d%3D%22M220%20360c120-150%20260-220%20380-220s260%2070%20380%20220%22%20fill%3D%22none%22%20stroke%3D%22%2367e8f9%22%20stroke-opacity%3D%220.5%22%20stroke-width%3D%2216%22%20stroke-linecap%3D%22round%22%20stroke-linejoin%3D%22round%22%2F%3E%0A%20%20%3Cpath%20d%3D%22M300%20398h600%22%20stroke%3D%22%2394a3b8%22%20stroke-opacity%3D%220.24%22%20stroke-width%3D%228%22%20stroke-linecap%3D%22round%22%2F%3E%0A%20%20%3Ctext%20x%3D%22220%22%20y%3D%22510%22%20fill%3D%22%23e2e8f0%22%20fill-opacity%3D%220.7%22%20font-family%3D%22Arial%2C%20Helvetica%2C%20sans-serif%22%20font-size%3D%2238%22%20letter-spacing%3D%228%22%3EINSIGHTS%3C%2Ftext%3E%0A%3C%2Fsvg%3E)
Verified event (primary source)
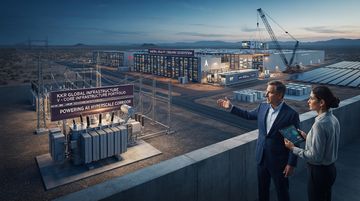
KKR closed its $19.2B flagship infrastructure “Core” fund focused on North America + Western Europe
KKR announced the final closing of KKR Global Infrastructure Investors V at $19.2 billion, described as a “Core” infrastructure fund.
The release specifies the fund invests “primarily in North America and Western Europe.” That geography matters because it puts pressure on two constrained bottlenecks investors consistently price into AI buildouts: available power and deployable capacity in data-center clusters.
What the primary source actually confirms
Fund size
$19.2B
Final closing of Fund V
Strategy label
“Core”
Risk/contract oriented as described by KKR
Geography
North America + Western Europe
Primary investment regions
Why it’s investable
This close is effectively a referendum on LP willingness to underwrite long-duration AI infrastructure—at scale
Most AI-linked capital previously flowed into faster-moving categories (semis, networking, software) where returns can be realized sooner. A “Core” infrastructure fund, however, is built to match:
- long build cycles (permitting, construction, interconnection),
- contract structures (longer-tenor revenues), and
- financing constraints (rate and refinancing risk management).
So the investor relevance isn’t just that KKR raised a big number—it’s that LP committees accepted the underwriting framework for grid + data-center-adjacent risk.
- validates LP pricing for interconnection and capex risk by committing $19.2B to a Core infra strategy
- signals capacity-focused deal flow by concentrating on regions where hyperscale demand meets grid constraints
- raises the probability of larger co-invested ticket sizes because big funds reduce the “first-close to deploy” bottleneck
Supply-chain lens (full transmission chain)
AI infrastructure isn’t one market—it’s a stack from generation to compute rooms
To make the $19.2B close translate into equity/credit implications, you need to map the infrastructure stack.
Upstream (power & grid): generation + transmission/interconnection capacity that turns “AI demand” into electrons.
Midstream (site enabling): grid interconnect works, substation upgrades, site development, and sometimes water/waste infrastructure.
Downstream (data-center capacity): colocation/wholesale data-center operators and digital real estate platforms that convert power availability into leased capacity.
A Core infrastructure fund can buy or finance assets across this chain, but the market will reward the whole ecosystem when LP capital de-risks the path from grid to racks.
| Layer | Bottleneck LPs are pricing | Where the $19.2B thesis likely shows up | Listed “public proxies” used later |
|---|---|---|---|
| Generation / grid / transmission | Capex timing + permitting + reliability | Longer-tenor contracted power or grid-enabling infrastructure | Duke Energy, American Water Works |
| Site enabling / utilities | Availability of utilities at data-center campuses | Infrastructure upgrades that de-risk “time-to-power” for builds | American Water Works |
| Data-center real estate | Lease-up timing and cash conversion from capacity | Ownership of capacity or development exposure where power is the constraint | Digital Realty, Equinix |
| Data / market plumbing for allocation | Benchmarking/indices/workflow needed for capital markets investing | Not direct grid exposure, but a sentiment tailwind when infrastructure allocators scale | S&P Global |
Deal-math (what LP behavior implies)
Why the “war-for-assets premium” should show up in multiples and contract terms
Large Core infra closes usually affect deal economics through three channels.
1) Lower cost of capital for the sector: more equity capital chasing fewer late-stage, “power-ready” assets can compress required returns.
2) More willingness to structure long contracts: if LPs accept the asset class framework, sponsors can negotiate revenue contracts that better match liabilities and reduce refinancing risk.
3) Higher bargaining power versus constrained project pipelines: when a sponsor has a $19.2B mandate, it can credibly offer earlier financing certainty—reducing developers’ funding gaps.
In practice, this tends to flow into: higher entry valuations for core platforms and stronger appetite for lower-volatility cash flows (contracted demand, regulated/utility-like characteristics, and disciplined development gating).
Data-backed public proxies (where the market should look)
Public-market lenses: digital capacity and grid-adjacent utilities are the easiest places to see the impact
- If Core infra capital reduces risk premiums, Digital Realty can see demand translate into steadier capacity leasing economics
- If power bottlenecks loosen via capital-backed buildouts, Equinix should have a cleaner path to absorb traffic into premium footprints
- If grid investment becomes easier to finance, Duke Energy should face less “funding gap” risk for capacity additions
- If site buildouts accelerate, American Water Works can benefit from higher utility infrastructure utilization
Important limitation: the $19.2B close does not specify targets by name in the primary release we opened, so any mapping from “KKR thesis” → “which operators benefit first” must be treated as a mechanism hypothesis, not a stated holding.
That said, the supply-chain mapping is directly aligned with the geography + Core framing disclosed in the KKR release.
5–8 research angles answered
What investors should test next (and what we can/can’t prove from public disclosures)
- Angle 1 — Was the close real and what exactly did KKR claim? Yes: the release confirms $19.2B final closing, Core strategy, and primary North America/Western Europe focus.
- Angle 2 — Is this the LP “go-ahead” for AI-adjacent infra? The close is consistent with that interpretation, but the release doesn’t enumerate data-center/power-grid allocations by percentage (not disclosed).
- Angle 3 — Does it imply a multiple change? It implies potential compression in required returns for qualifying assets via scale-driven competition; actual multiple impact needs deal-by-deal evidence.
- Angle 4 — Which parts of the stack should move first? Capacity availability (power/site enabling) is typically upstream, while public market effects often show up in data-center operators once lease economics stabilize.
- Angle 5 — Where is the “downstream” market evidence? Look for improvements in lease-up cadence and guidance revisions for colocation/wholesale capacity constrained by power.
- Angle 6 — Where is the “upstream” evidence? Track utility grid capex commentary and interconnection progress (project-level evidence will matter).
- Angle 7 — Can we quantify the ROI or IRR of this specific close? Not from the primary close release; infrastructure fund performance is not provided in the KKR press release we opened.
Horizons
Short-term vs long-term: what this close should change first
Short-term (days to quarters): markets should reprice the probability that “power-ready” infrastructure transactions clear financing quickly. In public proxies, that often shows up as multiple stability/expansion for platforms where supply constraints are the gating factor.
Long-term (1–3 years): the thesis should reveal itself in completed capacity additions and the durability of contracted cash flows. If LP capital keeps scaling at the same time that power interconnection timelines improve (or are better financed), the sector’s risk premium should structurally drift down.
Public-market stocks most tied to the power → site → capacity transmission
- KKR’s $19.2B close increases confidence in its Core infrastructure fundraising engine, which should support future fee-earning AUM growth.
- KKR should benefit from deal flow and structuring fees as larger mandates accelerate sponsor participation across grid and data-center projects.
- Over 1–3 years, the key test is whether this Core fundraising translates into higher realizations and durable carry generation.
- Power-constrained customers tend to lease when capacity is credible; if LP-funded infrastructure reduces schedule risk, Digital Realty’s lease-up cadence should improve (mechanism hypothesis).
- This should show up first in guidance and occupancy/remaining capacity metrics, which determine forward cash flow expectations.
- Over 1–3 years, the thesis works best if new builds come online faster in regions where power availability is the limiting factor.
- If “time-to-power” compresses for data-center buildouts, Equinix should face less capacity friction in absorbing interconnection-heavy demand (mechanism hypothesis).
- Near-term, investors should watch for evidence that demand converts into premium pricing or reduced concession pressure.
- Over 1–3 years, durable impact requires that power and site enabling scale alongside build pipelines.
- More credible funding for grid buildouts can support Duke’s ability to execute capacity additions within constrained timelines (mechanism hypothesis).
- However, if infrastructure competition raises costs or regulatory timelines, rate/return timing may offset benefits in the short run.
- The long-term path depends on actual execution of interconnection and transmission upgrades.
- Utility scale coordination can enable faster site development; if so, American Water can see utilization support from accelerated buildouts (mechanism hypothesis).
- But water infrastructure needs can be location-specific, so the benefit may be uneven across data-center clusters.
- Over 1–3 years, the thesis is most likely to hold where water/wastewater upgrades become a binding constraint.
- When LPs and allocators scale into infrastructure, capital markets workflow and benchmarking demand can rise (indirect channel).
- Short-term stock impact is not guaranteed because S&P Global’s drivers are broader than infrastructure alone.
- A watch item is whether infrastructure allocators increase usage of analytics/indices during deal-heavy periods over 6–18 months.