%22%2F%3E%0A%20%20%3Ccircle%20cx%3D%22220%22%20cy%3D%22150%22%20r%3D%22180%22%20fill%3D%22%2322d3ee%22%20fill-opacity%3D%220.12%22%2F%3E%0A%20%20%3Ccircle%20cx%3D%221010%22%20cy%3D%22130%22%20r%3D%22220%22%20fill%3D%22%2338bdf8%22%20fill-opacity%3D%220.08%22%2F%3E%0A%20%20%3Ccircle%20cx%3D%22920%22%20cy%3D%22520%22%20r%3D%22170%22%20fill%3D%22%2322d3ee%22%20fill-opacity%3D%220.06%22%2F%3E%0A%20%20%3Cpath%20d%3D%22M140%20430h920%22%20stroke%3D%22url(%23line)%22%20stroke-width%3D%2212%22%20stroke-linecap%3D%22round%22%2F%3E%0A%20%20%3Cpath%20d%3D%22M220%20360c120-150%20260-220%20380-220s260%2070%20380%20220%22%20fill%3D%22none%22%20stroke%3D%22%2367e8f9%22%20stroke-opacity%3D%220.5%22%20stroke-width%3D%2216%22%20stroke-linecap%3D%22round%22%20stroke-linejoin%3D%22round%22%2F%3E%0A%20%20%3Cpath%20d%3D%22M300%20398h600%22%20stroke%3D%22%2394a3b8%22%20stroke-opacity%3D%220.24%22%20stroke-width%3D%228%22%20stroke-linecap%3D%22round%22%2F%3E%0A%20%20%3Ctext%20x%3D%22220%22%20y%3D%22510%22%20fill%3D%22%23e2e8f0%22%20fill-opacity%3D%220.7%22%20font-family%3D%22Arial%2C%20Helvetica%2C%20sans-serif%22%20font-size%3D%2238%22%20letter-spacing%3D%228%22%3EINSIGHTS%3C%2Ftext%3E%0A%3C%2Fsvg%3E)
Grid buildout • Procurement lead times • Financing math
The real bottleneck is not AI servers—it’s the utility transformer waiting behind the queue
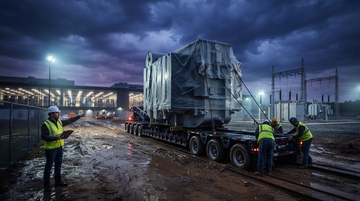
If you map the AI supply chain the way data centers are usually modeled—racks, UPS, switchgear, generators—the story is “installed power shows up when equipment arrives.” Utility-scale interconnection breaks that assumption. Large power transformer lead times have stretched into multi‑year territory, and that timing dictates when grid upgrades can physically energize new load. Transformer delivery windows now behave like a multi-year control knob on connection speed.
Lead times for large power transformers have lengthened into “years” territory
Selected published lead-time references (not a single standardized industry dataset, but consistent directionally).
Unit: weeks
2021 (earlier reference point)
Published “around 50 weeks” reference.
50
2024 (average)
Published “120 weeks on average” reference.
120
Some specialized units (procurement timelines)
36 months referenced as “36 to 48 months”; shown at 36 months equivalent weeks.
216
Cause → mechanism
Why transformers throttle AI-connected load: capacity plus material constraints create queue physics
- Transformer lead times have risen from ~50 weeks to ~120 weeks on average, compressing the “time-to-energize” window for new substations and generator step-ups.
- Even when distribution transformer availability improves, large power transformers remain locked behind orders sized for high-voltage substations and generator interties.
- Material and manufacturing bottlenecks (e.g., electrical steel demand and constrained inputs) amplify the queue effect: utilities can’t “order their way out” in a normal procurement cycle.
Upstream • Trade exposure • Policy
A transformer lead-time slowdown is also a tariff and import-dependence problem
The transformer market’s capacity constraints collide with the reality that the U.S. grid-equipment import base is large. In practice, when a utility needs large units on a fixed interconnection timeline, it turns to the available production slots (often internationally sourced) and absorbs both price increases and any tariff/friction effects. On top of that, 2026 tariff policy remains a moving variable for China-linked industrial supply chains.
For investors, the key is not whether tariffs apply to every bill of materials detail—it’s whether tariffs increase landed cost exactly when projects can least afford schedule slippage. When delivery risk forces “priority procurement” or substitutions (or pushes developers toward on-site generation), the resulting cash-flow timing changes can outweigh the equipment cost line item.
Capital markets → decision horizon
The ~5.2% long yield turns transformer delays into negative NPV for grid expansion
Grid upgrades and interconnection payments are not just capex decisions—they’re discounted cash-flow decisions. When equipment delivery moves out by multiple years, the project’s spend can occur before the benefit arrives (or benefits arrive later), and the present value of regulated/contracted cash flows declines as discount rates rise.
30-year Treasury yield reference
5.2%
30-year Treasury note reached ~5.2% (reported as highest in ~19 years).
Supply chain mapping
Who gets connected first: vendors with large-order throughput and balance-sheet stamina
When transformer lead times extend, the winning strategy looks less like cost-minimization and more like allocation: firms that can secure production capacity, deliver project-ready units, and finance working capital stress can translate backlog into cash conversion and margin stability. That’s why multi-year order books and resilient earnings profiles matter in 2026 grid cycles.
Fundamentals • Through-cycle revenue
Financial resilience matters because the backlog-to-cash path is stretched
| Company | Latest fiscal period revenue | Latest fiscal period operating profit | Latest fiscal period net income |
|---|---|---|---|
| Eaton | $24.878B | $4.866B | $3.794B |
| GE Vernova | $34.943B | $0.787B | $1.552B |
| Siemens Energy | €34.465B | €2.125B | €1.184B |
| Mitsubishi Electric | ¥5.258T | ¥328.525B | ¥284.949B |
These figures don’t prove causality to transformer queues, but they illustrate the investor lens: long-lead supply chains often stress working capital and execution. Companies with positive operating profitability in the latest fiscal period can better withstand backlog timing volatility.
Horizons
What to watch next (and what changes first)
- Short-term (days–quarters): project schedule announcements and utility interconnection milestones will move with equipment delivery confirmations; winning bids will start to look like capacity allocations, not lowest-price awards.
- Short-term (days–quarters): pricing rhetoric in grid equipment supply chains will matter more than demand headlines; delays can reprice “time,” not just steel and copper.
- Long-term (1–3 years): once lead-time normalization begins (if it does), the gap between providers with manufacturing flexibility and those without should widen in cash-flow terms; queue position should translate into backlog visibility, then earnings durability.
- Long-term (1–3 years): tariff and import-friction scenarios will influence landed cost and contract negotiation leverage; outcomes will depend on whether domestic alternatives can ramp fast enough.
Listed companies exposed to the utility transformer / grid-equipment bottleneck
- Eaton reported FY2024 revenue of $24.878B and net income of $3.794B, supporting the idea that it can fund stretched delivery cycles without immediate profitability collapse.
- If transformer queue pressure keeps grid upgrade capex elevated, Eaton’s electrification and grid-related offerings can benefit from sustained utility procurement through 2026–2027.
- Rising long yields can pressure customers’ regulated/contract discount rates, but Eaton’s FY2024 operating income of $4.866B suggests it may better absorb demand timing volatility.
- GE Vernova’s FY2024 revenue was $34.943B, but operating income was only $0.787B and net income $1.552B; margin fragility could increase if transformer-linked delivery risk worsens.
- If grid buildouts are delayed but not cancelled, GE Vernova may still convert order books into revenue later; timing mismatches likely matter more than headline demand over 2026–2027.
- Higher financing costs can slow interconnection pace, making GE Vernova’s electrification execution more sensitive to project schedule shifts.
- Siemens Energy reported FY2024 revenue of €34.465B with net income €1.184B; its profitability profile suggests it can participate in large-grid orders despite cycle swings.
- Lead-time-driven demand for transformers/switchgear can support order intake, but execution risk and market timing can still affect earnings; follow 2026 backlog conversion and cash generation.
- Tariff/import-friction scenarios can swing margin depending on sourcing and contracting terms, so landing-cost pass-through is the key watch item.
- Mitsubishi Electric’s FY2024 (ended Mar 31, 2024) revenue was ¥5.258T with net income ¥284.949B; strong profitability supports durability amid multi-year project procurement.
- If utilities prioritize connection readiness, demand for grid equipment with long project lead times can remain sticky; Mitsubishi Electric can benefit through 2026–2028 if delivery schedules stay tight.
- Long-yield environments favor resilient cash flows; its FY2024 operating income of ¥328.525B suggests earnings may be less dependent on short-term financing conditions.