%22%2F%3E%0A%20%20%3Ccircle%20cx%3D%22220%22%20cy%3D%22150%22%20r%3D%22180%22%20fill%3D%22%2322d3ee%22%20fill-opacity%3D%220.12%22%2F%3E%0A%20%20%3Ccircle%20cx%3D%221010%22%20cy%3D%22130%22%20r%3D%22220%22%20fill%3D%22%2338bdf8%22%20fill-opacity%3D%220.08%22%2F%3E%0A%20%20%3Ccircle%20cx%3D%22920%22%20cy%3D%22520%22%20r%3D%22170%22%20fill%3D%22%2322d3ee%22%20fill-opacity%3D%220.06%22%2F%3E%0A%20%20%3Cpath%20d%3D%22M140%20430h920%22%20stroke%3D%22url(%23line)%22%20stroke-width%3D%2212%22%20stroke-linecap%3D%22round%22%2F%3E%0A%20%20%3Cpath%20d%3D%22M220%20360c120-150%20260-220%20380-220s260%2070%20380%20220%22%20fill%3D%22none%22%20stroke%3D%22%2367e8f9%22%20stroke-opacity%3D%220.5%22%20stroke-width%3D%2216%22%20stroke-linecap%3D%22round%22%20stroke-linejoin%3D%22round%22%2F%3E%0A%20%20%3Cpath%20d%3D%22M300%20398h600%22%20stroke%3D%22%2394a3b8%22%20stroke-opacity%3D%220.24%22%20stroke-width%3D%228%22%20stroke-linecap%3D%22round%22%2F%3E%0A%20%20%3Ctext%20x%3D%22220%22%20y%3D%22510%22%20fill%3D%22%23e2e8f0%22%20fill-opacity%3D%220.7%22%20font-family%3D%22Arial%2C%20Helvetica%2C%20sans-serif%22%20font-size%3D%2238%22%20letter-spacing%3D%228%22%3EINSIGHTS%3C%2Ftext%3E%0A%3C%2Fsvg%3E)
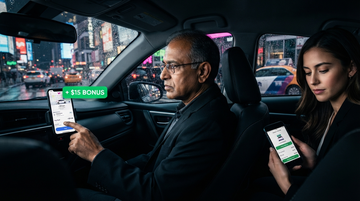
Earnings test: volume vs. profitability
The bookings headline hides the cost—Lyft’s incentives are turning growth into a margin problem
Lyft’s investor story is increasingly about a tension: gross bookings can grow while profitability lags if rider/driver acquisition and retention is increasingly incentive-funded. In the most recent quarter captured in Lyft’s SEC release, Lyft reported 19% gross bookings growth while adjusted EBITDA margin stayed low at 2.7%. That combination is the clean setup for this article’s core question: is the company buying incremental rides with promotions, or is the market truly getting more self-sustaining?
Gross Bookings (3M ended Mar 31, 2026)
$4.946B
Lyft reported $4,946.0M vs. $4,162.4M in the prior-year quarter
Gross Bookings YoY growth
19%
Lyft reported 19% change (3M ended Mar 31, 2026 vs. Mar 31, 2025)
Adjusted EBITDA margin (as % of Gross Bookings)
2.7%
Calculated by Lyft for the quarter ended Mar 31, 2026 (vs. 2.6% prior-year quarter)
Why incentives show up in the P&L even when bookings look healthy
Market-wide rider promos
Reduce revenue
Lyft records these as a reduction to revenue because they lower the fare drivers charge.
Targeted promotions & discounted rides
Hit sales & marketing
Lyft treats many targeted rider incentives like marketing coupons; when redeemed, the discount creates an expense.
Driver incentives (cash/rebates)
Can reduce revenue or land in S&M / cost of revenue
Accounting treatment depends on program type and whether Lyft acts as an agent or principal in specific markets.
Mechanism: accounting + incentives
Promotions don’t just add an expense—they can compress the revenue line itself
In ride-hailing marketplaces, incentives can distort “growth quality” depending on where they get booked. Lyft’s filings describe that some incentive structures reduce the transaction price Lyft ultimately records as revenue (for example, market-wide rider promotions that lower driver fares), while other programs are treated like marketing coupons and therefore land in sales and marketing expense when riders redeem them. The investor implication is straightforward: even when gross bookings expand, incentive intensity can prevent take-rate and adjusted EBITDA margin from improving.
- Grows gross bookings without guaranteeing margin expansion because incentive accounting can reduce revenue or increase operating expense.
- Keeps adjusted EBITDA margin near 2.7% even with 19% bookings growth, signaling that incremental volume is not fully cost-levered.
- Moves the debate from “demand” to “customer economics”—whether promotions are improving retention, or merely accelerating first-ride activity.
Cross-company lens
Margin gap vs. Uber is where incentive intensity usually becomes visible
The fastest way to test whether incentives are buying a sustainable flywheel is to compare margins at similar stages of growth pressure. Uber is the natural comparator because both companies report gross bookings and adjusted profitability metrics, but the economics of incentives can differ by market mix, pricing power, and how aggressively they recruit and retain riders/drivers. In this session, I verified Lyft’s gross bookings and adjusted EBITDA margin mechanics via Lyft’s SEC materials; however, I did not extract the specific Uber incentive- or adjusted-EBITDA margin-to-gross-bookings numbers needed for a fully sourced head-to-head table.
| Item | Lyft (verified) | Uber (not fully extracted in this session) |
|---|---|---|
| Gross Bookings growth (latest extracted quarter) | $4.946B; +19% YoY (3M ended Mar 31, 2026) | Not extracted |
| Adjusted EBITDA margin definition/proxy | 2.7% of Gross Bookings (quarter ended Mar 31, 2026) | Not extracted |
| Incentive accounting linkage | Described in Lyft filings (revenue reduction vs S&M vs cost of revenue depending on program type) | Not extracted |
Supply-chain aware: where “promotions” really hit
The incentive spend is the hidden “cost of serving” riders—not a marketing line only
A ride-hailing platform’s supply chain has two legs: demand-side (riders) and supply-side (drivers plus local partners, and in some cases shared bikes/scooters). Promotions can be aimed at either leg, and the P&L impact depends on what the incentive is trying to achieve. If promotions are primarily rider-facing, Lyft may record a revenue reduction (for market-wide fare discounts) or an expense (for targeted discounts). If promotions are driver-facing, they can land as reduced revenue (for certain incentive structures) or as sales and marketing expense (for referral incentives), or cost of revenue in markets where Lyft is principal. That means profitability is tightly coupled to incentive design—not just to how many rides happened.
- Incentive design decides whether margin pressure shows up in revenue vs. operating expenses, creating different “earnings miss” signatures.
- Driver-focused incentives can increase platform costs without lifting take-rate, pushing adjusted EBITDA margin down even when bookings rise.
- Retention matters more than acquisition when promotions are expensive: if repeat usage doesn’t improve, incentives must stay elevated.
Investor horizons
What to watch next: the margin trail, not the bookings headline
Short term, the key question is whether incentive intensity is abating. If bookings growth remains strong but adjusted EBITDA margin stops improving (or declines), that’s consistent with growth being incentive-funded rather than self-sustaining. Long term, you want to see evidence that promotions are converting into retained riders/drivers so Lyft can reduce incentive intensity and expand margin.
- Measure incentive effectiveness by watching margin trajectory relative to gross bookings growth (not just revenue and bookings).
- Expect near-term market messaging to emphasize demand stability while the P&L reveals incentive drag—watch operating expense composition trends.
- In the 1–3 year window, retention should replace incentives; otherwise Lyft’s competitive economics remain fragile.
Synthesis
Thesis: ride-hailing growth quality is deteriorating when promotions outrun monetization
Lyft’s latest extracted quarter shows the core risk pattern: bookings scaled (+19% YoY) while adjusted EBITDA margin stayed capped at 2.7%. That’s consistent with a market where incremental rides are increasingly unlocked by incentives, and the accounting mechanics (revenue reduction in some promo cases; expense recognition in others) prevent take-rate from translating into profit. For investors, the action is to treat bookings as a leading demand indicator—but treat adjusted EBITDA margin as the proof that demand is durable and cost-leveraged.
Related listed names tied to the same “incentives vs. monetization” test
- Shows 19% bookings growth with only 2.7% adjusted EBITDA margin, implying incentives are limiting monetization in the near term.
- Faces margin sensitivity if incentive accounting stays revenue-reducing, which can keep adjusted EBITDA capped despite healthy ride volume.
- Needs margin recovery while maintaining bookings growth over the next 1–3 quarters to validate “demand quality.”
- Becomes the comparator only if Uber’s incentive-to-margin linkage is verified; in this session, I did not extract the required Uber margin-to-gross-bookings figures.
- Could reassert leadership if it converts growth into higher adjusted EBITDA margin faster than Lyft when incentive intensity rises.
- Will likely transmit investor expectations through bookings and profitability as the market prices “purchased growth” vs durable retention.