Fool - Investing News8/14/2026Neutral
If I Could Teach All Investors 1 Attitude About the Stock Market, It's This
Investing is hard. We should all try to stay humble about it.

Toyota Motor Corporation is a multinational automotive manufacturer responsible for the design, production, assembly, and sale of a diverse range of passenger ...
Plutux is not an investment adviser. Market data and AI-generated analysis are for information and education only, not investment advice. Disclaimer
Est. EPS $3173.96 · Revenue $54.55T · 2 analysts
Est. EPS $940.06 · Revenue $14.58T · 1 analysts
Est. EPS $944.56 · Revenue $14.15T · 1 analysts
Est. EPS $3552.12 · Revenue $56.56T · 3 analysts
EPS ¥1222.20 · Revenue ¥13.70T
$95.00 per share
$95.00 per share
EPS ¥3130.10 · Revenue ¥50.68T
EPS ¥982.20 · Revenue ¥13.70T
EPS ¥715.10 · Revenue ¥12.38T
| Metric | Latest | YoYYoY means Year-over-Year. It compares the latest annual value with the previous annual value to show long-term trend strength. | QoQQoQ means Quarter-over-Quarter. It compares the latest quarter with the immediately previous quarter to show short-term momentum changes. |
|---|---|---|---|
| RevenueThe total money that came through the front door from selling things, before paying a single bill. Think of it as the grand total of every credit card swipe from customers. (YoY compares this year to last year's performance, while QoQ compares the current three months to the previous three). | $50685.0B | +5.5% | +6.8% |
| Net IncomeThe absolute bottom line. If the company paid every single supplier, employee, banker, and tax collector, this is the actual money left in their pocket at the end of the day. | $3985.8B | -16.4% | +79.8% |
| Gross MarginThe basic markup. If they sell a $100 pair of sneakers, this percentage tells you how much of that price tag is profit right after paying for the rubber and shoelaces, but before paying for things like store rent or TV commercials. | +16.7% | -16.3% | +19.0% |
| Operating MarginThe 'day job' efficiency score. Out of every dollar a customer spends, this shows how many cents the company keeps after making the product AND paying for all the everyday corporate overhead (like salaries, marketing, and keeping the lights on). | +7.4% | -25.6% | +73.9% |
| Net MarginThe final take-home percentage. When you strip away every conceivable cost, tax, and interest payment, this is the exact number of cents the company truly gets to keep from every dollar in sales. | +7.9% | -20.7% | +68.3% |
| Free Cash FlowThe holy grail of corporate cash. It's the spendable, physical money left over after the business pays for its daily operations AND buys the big, expensive upgrades (like new factories or servers) it needs to survive. This is the 'free' money they can use to pay dividends or buy back stock. | $592.1B | +137.9% | -277.5% |
| FCF MarginThe ultimate cash conversion rate. It shows how good the company is at turning regular sales directly into cold, hard, spendable cash. A high percentage means the business is an absolute cash-printing machine. | +1.2% | +135.9% | -266.2% |
| Debt / EquityThe financial risk gauge. It compares how much of the company's empire was built using borrowed money (loans) versus the owners' own money (shareholders). A high number means they are heavily leveraged and playing a riskier game; a low number means they are playing it safe. | 108.2% | +0.2% | +8.8% |
| Current RatioThe 12-month survival check. It simply compares the cash they have right now (plus things they can quickly turn into cash) against the immediate bills they absolutely must pay this year. A score above 1 means they have enough in the wallet to cover the upcoming bills without panicking. | 1.27x | +1.2% | -8.3% |
| Total AssetsThe absolute size of the company's empire. It bundles together absolutely everything of value they own—from the cash in the register and the inventory in the warehouse, to the software patents in the vault and the factories on the ground. | $105980.0B | +13.2% | -3.8% |
| Metric | Annual (A vs E) | Annual Surprise | Quarter (A vs E) | Quarter Surprise |
|---|---|---|---|---|
| EPS Surprise | 3130.10 vs 2945.23 | +6.3% | 1222.20 vs 940.06 | +30.0% |
| Revenue Surprise | $50685.0B vs $51537.3B | -1.7% | $13703.5B vs $14580.9B | -6.0% |
| Date | Executive | Title | Security | Side | Shares | Price |
|---|---|---|---|---|---|---|
| Aug 25, 2026 | Ueda Tatsuro | officer: Operating Officer | Common Stock | A | 86 | $19.53 |
| Aug 25, 2026 | Tomoyama Shigeki | officer: Executive Fellow | Common Stock | A | 14 | $19.53 |
| Aug 25, 2026 | Oshima Masahiko | director | Common Stock | A | 71 | $19.53 |
| Aug 25, 2026 | Osada Hiromi | director | Common Stock | A | 29 | $19.53 |
| Aug 25, 2026 | Olcott George Cunningham | director | Common Stock | A | 72 | $19.53 |
Unknown Executive : Thank you very much for joining us today, and welcome to Toyota Motor Corporation Fiscal Year 2026 Financial Results Briefing. I'd like to thank you very much for attending despite your busy schedules. I am Hashimoto the moderator of this conference. I am from Corporate Communications. So I would like to introduce our speakers first, Kenta Kon, President and Chief Executive Officer. Yoichi Miyazaki, Executive Vice President and Chief Financial Officer; and Takanori Azuma, Accounting Group Chief Officer. And from Corporate Communications Chief Officer, Hiroyuki Ueda. As for our agenda, this conference will begin with presentation by Takanori Azuma and Yoichi Miyazaki to explain the financial results, followed by a brief greeting by our President, Kenta Kon, and then we will have a Q&A session at the very end. So I'd like to hand it over to Takanori Azuma, please. Takanori Azuma : Hello. Ladies and gentlemen, I am Azuma, Accounting Group Chief Officer. We'd like to start by sincerely thanking our customers around the world who love Toyota cars, our shareholders who support our efforts as well as our dealers and suppliers and all other stakeholders involved. Thank you so very much. I will begin with a summary of the financial results for the fiscal year ended March '26. Operating income for fiscal year '26 amounted to JPY 3.8 trillion. Despite the impact of U.S. tariffs, we were able to secure profits in line with our guidance due to increased vehicle sales volumes and the effects of price revisions underpinned by strong product competitiveness as well as steadily accumulated improvement efforts such as expanded value chain profits. Taking into account the Middle East impacts, we are forecasting operating income for the fiscal year ending March '27 of JPY 3.0 trillion, representing a year-on-year decrease of JPY 800 billion. As a result, we expect operating income to decline for the third consecutive year. We believe this is because our response to changes in the operating environment has been limited to measures that can be implemented in the short term, while progress on business structural transformations from a mid- to long-term perspective remains only partly complete. Therefore, in the current fiscal year, we aim to return to a sustainable growth trajectory. Regarding shareholder returns, the dividend for fiscal year '26 will be JPY 95 per share, an increase of JPY 5 year-on-year. And for fiscal year '27, we plan another increase of JPY 5 for a forecast annual dividend of JPY 100 per share, and we will continue to uphold our policy of stable dividend increases to reward our long-term shareholders. Now I'll explain the details of the results for the fiscal year ended March '26. Consolidated vehicle sales for this fiscal year reached 9,595,000 units or 102.5% year-on-year. Toyota and Lexus vehicle sales totaled 10,477,000 units or 102.0% over the previous percent that is over the previous fiscal year. Thanks to strong …
| Name | Title | Compensation | Gender | Year Born | Status |
|---|---|---|---|---|---|
Koji Sato | Vice Chairman & Chief Industry Officer | JPY 2,379,362 | Male | 1969 | Active |
Yoichi Miyazaki | CFO, Operating Officer, Executive VP & Director | JPY 1,682,504 | Male | 1963 | Active |
Hiroki Nakajima | Operating Officer, Executive VP, CTO & Director | JPY 1,651,114 | Male | 1962 | Active |
Simon Humphries | Chief Branding Officer, Senior GM of Design, Head of Design & Operating Officer | JPY 1,049,750 | Male | 1967 | Active |
Kenta Kon | President, CEO & Representative Director | JPY 678,024 | Male | 1968 | Active |
Takanori Azuma | Chief Risk Officer & Chief Officer of Accounting Group | — | — | — | Active |
Masayoshi Shirayanagi | Senior Managing Officer and Chief Officer of External & Public Affairs Group | — | Male | 1962 | Active |
Shigeki Tomoyama | Executive Fellow & CEO of Japan Business Group | — | Male | 1958 | Active |
Satoshi Ogiso | Senior Managing Officer & President of CV Company | — | Male | 1961 | Active |
Yasuhiko Sato | Senior Managing Officer & Chief Officer of Japan Sales Business Group | — | Male | 1960 | Active |
Masahiro Yamamoto | Chief Officer of General Administration & Human Resources Group | — | — | — | Active |
Hirofumi Muta | Chief Officer -Safety & Health Promotion, Plant & Environmental Engg Divs, Production Control Group | — | Male | 1956 | Active |
Gill A. Pratt | Chief Scientist, Chief Executive Officer & Executive Fellow of Toyota Research Institute, Inc. | — | — | — | Active |
Nobuhiko Murakami | Senior Managing Officer & Chief Executive Officer of East Asia, Oceania & Middle East Region | — | Male | 1959 | Active |
Investing is hard. We should all try to stay humble about it.
Toyota is recalling 655,000 Camrys worldwide, including 508,354 in the US, over a display defect that can deactivate turn signals and hazard lights.
Prefer to listen? Hear this as a ~5-minute audio briefing on The GuruFocus Brief.Stock NewsStocks edge up ahead of key inflation data: U.S. stock futures rose s
Toyota recalled about 655,000 Camry vehicles globally over a display error that may deactivate turn signals and hazard lights.
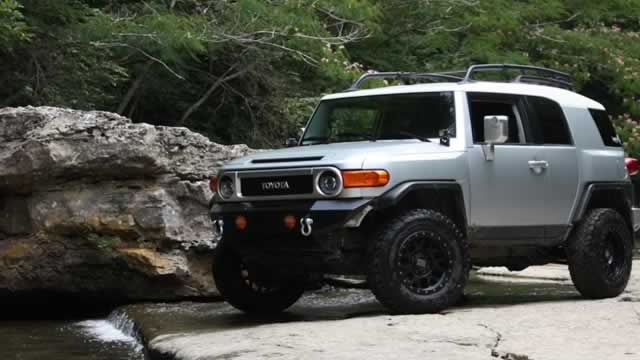
Toyota is recalling 508,354 vehicles in the U.S. as an instrument cluster that fails to display critical safety information increases the risk of a crash or injury, the National Highway Traffic Safety Administration said on Tuesday.