Zacks Investment Research8/27/2026Neutral
Are You Looking for a Top Momentum Pick? Why Trekor Metals (TGB) is a Great Choice
Does Trekor Metals (TGB) have what it takes to be a top stock pick for momentum investors? Let's find out.
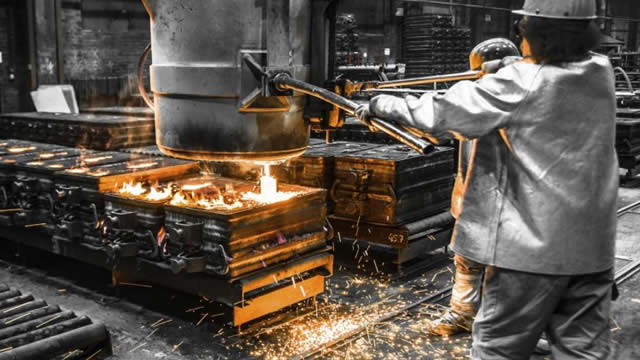
Trekor Metals Limited is a mining company focused on the acquisition, development, and operation of mineral resource properties. Its exploration activities target ...
Plutux is not an investment adviser. Market data and AI-generated analysis are for information and education only, not investment advice. Disclaimer
Est. EPS $0.17 · Revenue $338.79M · 2 analysts
Est. EPS $0.17 · Revenue $358.29M · 2 analysts
Est. EPS $0.55 · Revenue $1.26B · 4 analysts
Est. EPS $0.29 · Revenue $408.70M · 1 analysts
EPS $0.04 · Revenue $232.61M
EPS CAD 0.05 · Revenue CAD 234.55M
EPS CAD -0.09 · Revenue CAD 672.90M
EPS CAD -0.09 · Revenue CAD 173.91M
EPS CAD 0.07 · Revenue CAD 116.08M
EPS CAD -0.10 · Revenue CAD 139.15M
| Metric | Latest | YoYYoY means Year-over-Year. It compares the latest annual value with the previous annual value to show long-term trend strength. | QoQQoQ means Quarter-over-Quarter. It compares the latest quarter with the immediately previous quarter to show short-term momentum changes. |
|---|---|---|---|
| RevenueThe total money that came through the front door from selling things, before paying a single bill. Think of it as the grand total of every credit card swipe from customers. (YoY compares this year to last year's performance, while QoQ compares the current three months to the previous three). | $672.9M | +10.7% | -0.8% |
| Net IncomeThe absolute bottom line. If the company paid every single supplier, employee, banker, and tax collector, this is the actual money left in their pocket at the end of the day. | $-30.1M | -123.7% | -7.4% |
| Gross MarginThe basic markup. If they sell a $100 pair of sneakers, this percentage tells you how much of that price tag is profit right after paying for the rubber and shoelaces, but before paying for things like store rent or TV commercials. | +26.0% | +35.1% | +0.1% |
| Operating MarginThe 'day job' efficiency score. Out of every dollar a customer spends, this shows how many cents the company keeps after making the product AND paying for all the everyday corporate overhead (like salaries, marketing, and keeping the lights on). | +20.5% | +63.7% | +10.8% |
| Net MarginThe final take-home percentage. When you strip away every conceivable cost, tax, and interest payment, this is the exact number of cents the company truly gets to keep from every dollar in sales. | -4.5% | -102.2% | -6.6% |
| Free Cash FlowThe holy grail of corporate cash. It's the spendable, physical money left over after the business pays for its daily operations AND buys the big, expensive upgrades (like new factories or servers) it needs to survive. This is the 'free' money they can use to pay dividends or buy back stock. | $69.6M | -53.4% | +130.0% |
| FCF MarginThe ultimate cash conversion rate. It shows how good the company is at turning regular sales directly into cold, hard, spendable cash. A high percentage means the business is an absolute cash-printing machine. | +10.4% | -57.9% | +131.9% |
| Debt / EquityThe financial risk gauge. It compares how much of the company's empire was built using borrowed money (loans) versus the owners' own money (shareholders). A high number means they are heavily leveraged and playing a riskier game; a low number means they are playing it safe. | 94.9% | -39.6% | -17.4% |
| Current RatioThe 12-month survival check. It simply compares the cash they have right now (plus things they can quickly turn into cash) against the immediate bills they absolutely must pay this year. A score above 1 means they have enough in the wallet to cover the upcoming bills without panicking. | 1.50x | -12.2% | -9.3% |
| Total AssetsThe absolute size of the company's empire. It bundles together absolutely everything of value they own—from the cash in the register and the inventory in the warehouse, to the software patents in the vault and the factories on the ground. | $2.5B | +12.6% | -27.1% |
| Metric | Annual (A vs E) | Annual Surprise | Quarter (A vs E) | Quarter Surprise |
|---|---|---|---|---|
| EPS Surprise | -0.09 vs 0.08 | -215.3% | 0.04 vs 0.17 | -75.5% |
| Revenue Surprise | $672.9M vs $672.3M | +0.1% | $232.6M vs $338.8M | -31.3% |
| Date | Executive | Title | Security | Side | Shares | Price |
|---|---|---|---|---|---|---|
| Oct 31, 2025 | L1 Capital Pty Ltd | 10 percent owner | Common Shares | — | 0 | — |
| Oct 31, 2025 | L1 Capital Pty Ltd | 10 percent owner | Common Shares | — | 0 | — |
| Oct 31, 2025 | L1 Capital Pty Ltd | 10 percent owner | Common Shares | — | 0 | — |
| Oct 31, 2025 | L1 Capital Pty Ltd | 10 percent owner | Common Shares | — | 0 | — |
| Oct 31, 2025 | L1 Capital Pty Ltd | 10 percent owner | Common Shares | — | 0 | — |
Operator: Thank you for standing by, and welcome to Taseko Mines Limited Q2 Earnings Conference Call. I would like to remind everyone that this call is being recorded and that all lines have been placed on mute to prevent any background noise. After the speakers' remarks, there will be a question-and-answer session. If you would like to ask a question during this time, simply press star followed by the number 1 on your telephone keypad. If you would like to withdraw your question, press star 1 again. Thank you. I would now like to turn the call over to Brian Bergot, Vice President, Investor Relations. Please go ahead. Brian Bergot: Thank you, Bryce. Welcome, everyone, and thank you for joining Taseko's second quarter 26 conference call. The news release and regulatory filing announcing our financial and operating results was issued yesterday after market close and is available on our website at tasekomines.com and on SEDAR plus. I am joined today in Vancouver by Taseko's president and CEO, Stuart McDonald, Taseko's Chief Financial Officer, Bryce Hamming, and our COO, Richard Tremblay. As usual, before we get into opening remarks by management, would like to remind our listeners that our comments and answers to your questions will contain forward looking information. This information by its nature is subject to risks and uncertainties. As such, actual results may differ materially from the views expressed today. For further information on these risks and uncertainties, I encourage you to read the cautionary note that accompanies our second quarter MD and A and the related news release. As well as the risk factors particular to our company These documents can be found on our website and also on SEDAR plus. I would also like to point out that we will use various non GAAP measures during the call. You can find explanations and reconciliations regarding these measures in the related news release. And finally, all dollar amounts we will discuss today are in Canadian unless otherwise specified. Following opening remarks, we will open the phone lines to analysts and investors for questions. I will now turn the call over to Stuart for his remarks. Stuart McDonald: Morning, and welcome, everyone. Thanks for joining us today. The Taseko Mines second quarter earnings call. It was a solid quarter for the company. A steady operating performance at Gibraltar, allowed us to capitalize on a great copper price. We have often talked about the leverage that we have to copper, and that was shown this quarter with very strong EBITDA and operating cash flows. Bryce can provide some more specifics on the financials in a minute, but first, I will start with a review of the operating highlights from the quarter. Starting with Florence. As it was the first full production quarter for the new operation. And we are very pleased with the progress on the ramp up to date. We were able to produce just over 5 million pounds of cathode in the quarter. At Florence, the operating …
| Name | Title | Compensation | Gender | Year Born | Status |
|---|---|---|---|---|---|
Stuart McDonald | President, Chief Executive Officer & Director | CAD 856,388 | Male | 1972 | Active |
Bryce Hamming | Chief Financial Officer | CAD 503,430 | Male | 1977 | Active |
Richard Tremblay | Chief Operating Officer | CAD 501,409 | Male | — | Active |
Sean Magee | Vice President of Corporation Affairs | CAD 309,294 | Male | 1966 | Active |
Terry Morris | Vice President of Operation | — | Male | — | Active |
Trevor R. Thomas | General Counsel & Secretary | — | Male | 1967 | Active |
Brian Bergot | Vice President of Investor Relations | — | Male | — | Active |
Does Trekor Metals (TGB) have what it takes to be a top stock pick for momentum investors? Let's find out.
Trekor (TGB) is well positioned to outperform the market, as it exhibits above-average growth in financials.
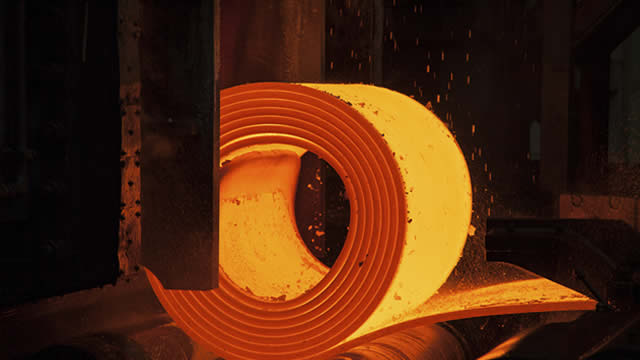
VANCOUVER, British Columbia, Aug. 19, 2026 (GLOBE NEWSWIRE) -- Trekor Metals Limited (TSX: TKO; NYSE American: TGB; LSE: TKO) (“Trekor” or the “Company”) is pleased to provide an update on the Company's wholly-owned Aley niobium project, an advanced-stage development project located in northeastern British Columbia, Canada.

Cetera Investment Advisers raised its stake in Taseko Mines Limited (NYSEAMERICAN:TGB) by 135.4% in the undefined quarter, according to the company in its most recent filing with the Securities and Exchange Commission. The institutional investor owned 129,371 shares of the company's stock after buying an additional 74,415 shares during the quarter. Cetera
Dimensional Fund Advisors LP trimmed its position in shares of Taseko Mines Limited (NYSEAMERICAN:TGB) by 43.4% during the undefined quarter, according to the company in its most recent filing with the SEC. The institutional investor owned 650,128 shares of the company's stock after selling 498,376 shares during the period. Dimensional Fund Advisors