
Zacks Investment Research8/20/2026Neutral
TFII vs. CHRW: Which Stock Is the Better Value Option?
Investors interested in Transportation - Services stocks are likely familiar with TFI International Inc. (TFII) and C.H. Robinson Worldwide (CHRW).
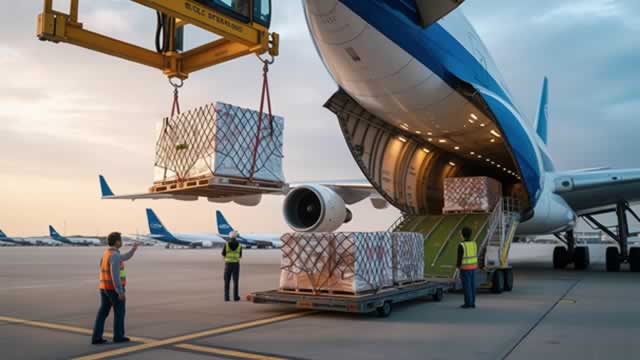
TFI International Inc. stands as a prominent provider of transportation and logistics solutions across North America, serving the United States, Canada, and ...
Plutux is not an investment adviser. Market data and AI-generated analysis are for information and education only, not investment advice. Disclaimer
$1.86 per share
Est. EPS $5.98 · Revenue $8.59B · 10 analysts
Est. EPS $2.21 · Revenue $2.29B · 8 analysts
Est. EPS $2.09 · Revenue $2.25B · 8 analysts
$1.86 per share
EPS $1.65 · Revenue $2.29B
EPS $0.53 · Revenue $1.95B
EPS $5.20 · Revenue $11.01B
EPS $1.01 · Revenue $1.95B
EPS $1.19 · Revenue $2.07B
| Metric | Latest | YoYYoY means Year-over-Year. It compares the latest annual value with the previous annual value to show long-term trend strength. | QoQQoQ means Quarter-over-Quarter. It compares the latest quarter with the immediately previous quarter to show short-term momentum changes. |
|---|---|---|---|
| RevenueThe total money that came through the front door from selling things, before paying a single bill. Think of it as the grand total of every credit card swipe from customers. (YoY compares this year to last year's performance, while QoQ compares the current three months to the previous three). | $11.0B | +31.1% | +17.5% |
| Net IncomeThe absolute bottom line. If the company paid every single supplier, employee, banker, and tax collector, this is the actual money left in their pocket at the end of the day. | $433.6M | +2.6% | +214.4% |
| Gross MarginThe basic markup. If they sell a $100 pair of sneakers, this percentage tells you how much of that price tag is profit right after paying for the rubber and shoelaces, but before paying for things like store rent or TV commercials. | +12.2% | -18.0% | +37.9% |
| Operating MarginThe 'day job' efficiency score. Out of every dollar a customer spends, this shows how many cents the company keeps after making the product AND paying for all the everyday corporate overhead (like salaries, marketing, and keeping the lights on). | +6.9% | -19.0% | +110.3% |
| Net MarginThe final take-home percentage. When you strip away every conceivable cost, tax, and interest payment, this is the exact number of cents the company truly gets to keep from every dollar in sales. | +3.9% | -21.7% | +167.6% |
| Free Cash FlowThe holy grail of corporate cash. It's the spendable, physical money left over after the business pays for its daily operations AND buys the big, expensive upgrades (like new factories or servers) it needs to survive. This is the 'free' money they can use to pay dividends or buy back stock. | $983.7M | +48.2% | +91.0% |
| FCF MarginThe ultimate cash conversion rate. It shows how good the company is at turning regular sales directly into cold, hard, spendable cash. A high percentage means the business is an absolute cash-printing machine. | +8.9% | +13.1% | +62.6% |
| Debt / EquityThe financial risk gauge. It compares how much of the company's empire was built using borrowed money (loans) versus the owners' own money (shareholders). A high number means they are heavily leveraged and playing a riskier game; a low number means they are playing it safe. | 138.1% | +23.7% | -6.8% |
| Current RatioThe 12-month survival check. It simply compares the cash they have right now (plus things they can quickly turn into cash) against the immediate bills they absolutely must pay this year. A score above 1 means they have enough in the wallet to cover the upcoming bills without panicking. | 1.03x | -0.0% | +2.0% |
| Total AssetsThe absolute size of the company's empire. It bundles together absolutely everything of value they own—from the cash in the register and the inventory in the warehouse, to the software patents in the vault and the factories on the ground. | $7.5B | +4.8% | +0.1% |
| Metric | Annual (A vs E) | Annual Surprise | Quarter (A vs E) | Quarter Surprise |
|---|---|---|---|---|
| EPS Surprise | 5.20 vs 4.15 | +25.4% | 1.65 vs 2.21 | -25.4% |
| Revenue Surprise | $11.0B vs $7.9B | +39.4% | $2.3B vs $2.3B | +0.1% |
Operator : Good day, ladies and gentlemen. Thank you for standing by. Welcome to TFI International Second Quarter 2026 Earnings Call. Please be advised that this conference call may contain statements that are forward-looking in nature and is subject to a number of risks and uncertainties that could cause actual results to differ materially. I would also like to remind everyone that this conference call is being recorded on July 27, 2026. Joining us on the call today are Alain Bedard, Chairman, President and Chief Executive Officer; and David Saperstein, Chief Financial Officer. I would now like to turn the conference over to Mr. Alain Bedard. Thank you. Please go ahead. Alain Bedard : Well, thank you, operator, and welcome, everyone, to our call this afternoon. Within the past now where TFI International reported stronger-than-expected quarterly results with adjusted diluted EPS of $1.85, exceeding our outlook range of $1.50 to $1.60 and up 38% year-over-year. All 3 of our business segments grew operating income by double digits, and we again produced solid free cash flow, which, as you know, is a long-standing priority of ours. Put simply, the investment we made during the recent slowdown, both in internal operation and strategic M&A are beginning to benefit our performance. We now have a balanced and diverse portfolio of operating companies and attractive end markets, which we continue to serve while always maintaining our focus on efficiency and related operating principles. And of course, there is no better than the hard-working people of TFI to execute on our plan and capitalize on the resulting opportunities. The foundational support for TFI International's thoughtful approach to value creation, both cycle in and cycle out, begins with our strong balance sheet, which improved further during the quarter. We generated more than $200 million of free cash flow, further supporting our ability to strategically allocate capital and, very importantly, return excess capital to shareholders whenever possible, including close to $40 million in quarterly dividends paid during the quarter. So let's take a high-level look at our second quarter financial results. Starting with the top line. Our total revenue before fuel surcharge of $1.9 billion was up 6% over the past year, while operating income climbed nearly 30% to $220 million. That reflects a margin of 11.6%, which was up more than 200 basis points relative to 9.5% figure a year earlier. Also on a consolidated basis, our net cash from operating activity rose to $256 million from $247 million. Now let's dig deeper into each of our 3 segments, starting with LTL, which was 38% of our segmented revenue before fuel surcharge. We generated $725 million of LTL revenue before fuel surcharge, up 3% year-over-year. Our LTL adjusted operating ratio was 88.5% and operating income of $86 million was up a very solid 17%, producing a return on invested capital of 12%. Now let's move to our truckload, for …
| Name | Title | Compensation | Gender | Year Born | Status |
|---|---|---|---|---|---|
Alain Bedard FCPA | President, Chief Executive Officer & Chairman | CAD 6,449,903 | Male | 1953 | Active |
David Saperstein | Chief Financial Officer | CAD 1,487,889 | Male | — | Active |
Steven A. Brookshaw | Senior Executive Vice-President of Truckload | CAD 929,780 | Male | — | Active |
Rick Hashie | Senior Executive Vice President | CAD 776,996 | Male | — | Active |
Kal Atwal | Senior Executive Vice President of Less Than Truckload | CAD 735,440 | Male | — | Active |
Junior Roy | Executive Vice President | CAD 486,712 | Male | — | Active |
Joel Andre CHRL | Vice President of Human Resources | — | Male | — | Active |
Chantal Martel | Vice President of Insurance & Compliance | — | Female | — | Active |
Johanne Dean | Vice President of Marketing & Communications | — | Female | — | Active |
Josiane-Melanie Langlois LL. | Vice President of Legal Affairs & Corporate Secretary | — | Female | — | Active |
Investors interested in Transportation - Services stocks are likely familiar with TFI International Inc. (TFII) and C.H. Robinson Worldwide (CHRW).
Roundhill's Roundhill Heavy Assets and Low Obsolescence ETF (NYSEARCA:LOHA) launched in May 2026 as a counterweight to the software and AI concentration dominating most passive equity portfolios.

TFI International demonstrates strong earnings momentum, with Q2 adjusted EPS up 38% and truckload operating income surging 50%. The Daseke acquisition is delivering substantial margin improvement, while TForce Freight offers significant upside if pricing and volume issues are resolved. The company trades at 23.5x 2026E EPS but drops below 18x 2027E, with a forward EV/EBITDA discount to XPO and Saia despite ongoing self-help opportunities.

Investors with an interest in Transportation - Services stocks have likely encountered both TFI International Inc. (TFII) and C.H. Robinson Worldwide (CHRW).

TFI International (NYSE:TFII) reported downbeat earnings for the second quarter on Monday.