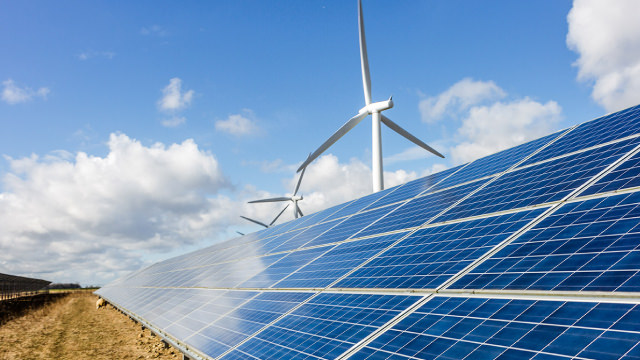
TransAlta Corporation specializes in the ownership, operation, and expansion of a diverse array of electricity generation facilities, with a geographical presence spanning ...
TransAlta Corporation (TAC) is one of Canada’s largest publicly traded power generators. The company operates as a non-regulated independent producer, focusing on the ownership, operation, and expansion of generation assets and the marketing of electricity and related energy products. With operations spanning Canada, the United States, and Western Australia, TransAlta ...TransAlta Corporation (TAC) is one of Canada’s largest publicly traded power generators. The company operates as a non-regulated independent producer, focusing on the ownership, operation, and expansion of generation assets and the marketing of electricity and related energy products. With operations spanning Canada, the United States, and Western Australia, TransAlta serves a broad customer base that includes municipalities, industrial and commercial customers, and other utility providers.
Business model and operations: TransAlta’s generating capacity is organized into four primary divisions—Hydro; Wind and Solar; Gas; and Energy Transition. This multi-technology mix supports flexibility in responding to changing market conditions and renewable development pathways. The company also participates in wholesale trading activities, which include trading electricity and energy commodities and using financial derivatives as part of its risk management and commercial activities.
Assets and footprint: TransAlta’s historical roots trace back to the early 20th century in Alberta, and it has operated key power assets for decades. The company is noted for a major presence in Alberta’s power system and has historically been strongly associated with coal generation via its large coal supply chain; more broadly, its generation portfolio reflects a transition agenda through diversified generation and energy-transition initiatives.
Products and services: Core “products” are electricity generated from hydro, wind/solar, and gas (and historically coal), delivered into regional grids through power purchase arrangements, market participation, and utility/wholesale counterparties. On the commercialization side, TransAlta provides wholesale electricity and energy-commodity marketing services and engages in derivative-based activities to manage exposures related to electricity prices, fuel costs, and other market variables.
Scale and financial/cost considerations: Based on market data, TransAlta has a market capitalization in the billions and an enterprise value substantially higher than sales, reflecting capital intensity typical of power generation. Like other generation owners, costs are materially influenced by fuel inputs (for dispatchable plants such as gas), maintenance and outage schedules, generation availability, and environmental/compliance requirements. Capital expenditures and ongoing asset modernization are central to sustaining output and supporting transitions among generation types.
Key people: Joel E. Hunter is listed as President and CEO in the provided materials, with other senior leadership including the company’s CFO.
Wishes/trajectory: The company’s stated structure and divisions emphasize expansion and adaptation—particularly through “Energy Transition”—aimed at balancing reliability, market participation, and longer-term decarbonization and modernization requirements.
YoYYoY means Year-over-Year. It compares the latest annual value with the previous annual value to show long-term trend strength.
QoQQoQ means Quarter-over-Quarter. It compares the latest quarter with the immediately previous quarter to show short-term momentum changes.
RevenueThe total money that came through the front door from selling things, before paying a single bill. Think of it as the grand total of every credit card swipe from customers. (YoY compares this year to last year's performance, while QoQ compares the current three months to the previous three).
$2.4B
-15.5%
-14.0%
Net IncomeThe absolute bottom line. If the company paid every single supplier, employee, banker, and tax collector, this is the actual money left in their pocket at the end of the day.
$-137.9M
-160.2%
+276.0%
Gross MarginThe basic markup. If they sell a $100 pair of sneakers, this percentage tells you how much of that price tag is profit right after paying for the rubber and shoelaces, but before paying for things like store rent or TV commercials.
+32.6%
-48.3%
+106.7%
Operating MarginThe 'day job' efficiency score. Out of every dollar a customer spends, this shows how many cents the company keeps after making the product AND paying for all the everyday corporate overhead (like salaries, marketing, and keeping the lights on).
-9.2%
-144.9%
+591.3%
Net MarginThe final take-home percentage. When you strip away every conceivable cost, tax, and interest payment, this is the exact number of cents the company truly gets to keep from every dollar in sales.
-5.7%
-171.3%
+337.3%
Free Cash FlowThe holy grail of corporate cash. It's the spendable, physical money left over after the business pays for its daily operations AND buys the big, expensive upgrades (like new factories or servers) it needs to survive. This is the 'free' money they can use to pay dividends or buy back stock.
$396.7M
-16.5%
-81.8%
FCF MarginThe ultimate cash conversion rate. It shows how good the company is at turning regular sales directly into cold, hard, spendable cash. A high percentage means the business is an absolute cash-printing machine.
+16.5%
-1.2%
-78.8%
Debt / EquityThe financial risk gauge. It compares how much of the company's empire was built using borrowed money (loans) versus the owners' own money (shareholders). A high number means they are heavily leveraged and playing a riskier game; a low number means they are playing it safe.
320.5%
+22.8%
-25.0%
Current RatioThe 12-month survival check. It simply compares the cash they have right now (plus things they can quickly turn into cash) against the immediate bills they absolutely must pay this year. A score above 1 means they have enough in the wallet to cover the upcoming bills without panicking.
0.73x
+5.8%
+10.7%
Total AssetsThe absolute size of the company's empire. It bundles together absolutely everything of value they own—from the cash in the register and the inventory in the warehouse, to the software patents in the vault and the factories on the ground.
Operator: Good morning. My name is Michelle, and I will be your conference operator today. At this time, I would like to welcome everyone to the TransAlta Corporation Second Quarter 2026 Results Conference Call. All lines have been placed on mute to prevent any background noise. After the speakers' remarks, there will be a question-and-answer session. If you would like to ask a question during this time, simply press star then 1 on your telephone keypad. If you would like to withdraw your question, please press star then 1 again. Thank you. Ms. Paris, you may begin your conference.
Stephanie Ann Paris: Thank you, Michelle. Good morning, everyone. My name is Stephanie Ann Paris, and I am the Vice President of Investor and Corporate Strategy of TransAlta. Welcome to TransAlta's second quarter 2026 conference call. With me today are Joel E. Hunter, President and Chief Executive Officer, Mike Politeski, EVP Finance and Chief Financial Officer, and Christopher D. Fralick, EVP Generation and Chief Operating Officer. Today's call is being webcast, and I invite those listening on the phone lines to view the supporting slides that are posted on our website. A replay of the call will be made available later today, and the transcript will be posted to our website shortly thereafter. All the information provided during this conference call is subject to the forward-looking statement qualification set out here on slide 2, detailed further in our MD&A and incorporated in full for purposes of today's call. All amounts referenced are in Canadian dollars unless otherwise noted. The non-IFRS terminology used, including adjusted EBITDA and free cash flow, are reconciled in the MD&A for your reference. On today's call, Joel and Mike will provide an overview of TransAlta's quarterly results. After these remarks, we will open the call for questions. With that, I will turn the call over to Joel.
Joel E. Hunter: Thanks, Stephanie. Good morning, everyone, and thank you for joining our second quarter conference call. TransAlta delivered solid operational and financial performance during the second quarter of 2026. Demonstrating our fleet's continued resilience during challenging market conditions. During the quarter, we delivered adjusted EBITDA of $291 million, free cash flow of $143 million or $0.47 per share and average fleet availability of 90.2%. Our Alberta merchant portfolio continues to be impacted by softer prices, our hedging strategy and active asset optimization generated realized prices that were well above spot prices during the quarter. Along with our hydro and wind assets providing significant environmental offsets to our gas fleet's 2025 carbon compliance obligation. We remain confident in achieving our 2026 guidance range, which Mike will talk about later. In the quarter, we continue to advance our data center strategy with CPP Investments and Brookfield. More broadly in Alberta, positive recent developments reinforce the momentum and collective …