WSJ8/6/2026Neutral
Burger King's New Whopper Strikes a Blow in Fast-Food Burger Wars
Company president said the revamped burger was helping win market share; McDonald's recently overhauled the Big Mac.
Restaurant Brands International Inc. (RBI), a prominent quick-service restaurant enterprise, maintains its headquarters in Toronto, Canada. Established in 1954, the company operates ...
Plutux is not an investment adviser. Market data and AI-generated analysis are for information and education only, not investment advice. Disclaimer
$2.54 per share
Est. EPS $1.08 · Revenue $2.54B · 14 analysts
$2.54 per share
Est. EPS $1.05 · Revenue $2.54B · 14 analysts
| Metric | Latest | YoYYoY means Year-over-Year. It compares the latest annual value with the previous annual value to show long-term trend strength. | QoQQoQ means Quarter-over-Quarter. It compares the latest quarter with the immediately previous quarter to show short-term momentum changes. |
|---|---|---|---|
| RevenueThe total money that came through the front door from selling things, before paying a single bill. Think of it as the grand total of every credit card swipe from customers. (YoY compares this year to last year's performance, while QoQ compares the current three months to the previous three). | $9.4B | +12.2% | +11.3% |
| Net IncomeThe absolute bottom line. If the company paid every single supplier, employee, banker, and tax collector, this is the actual money left in their pocket at the end of the day. | $776.0M | -24.0% | +50.0% |
| Gross MarginThe basic markup. If they sell a $100 pair of sneakers, this percentage tells you how much of that price tag is profit right after paying for the rubber and shoelaces, but before paying for things like store rent or TV commercials. | +41.1% | +14.2% | -30.5% |
| Operating MarginThe 'day job' efficiency score. Out of every dollar a customer spends, this shows how many cents the company keeps after making the product AND paying for all the everyday corporate overhead (like salaries, marketing, and keeping the lights on). | +23.7% | -17.6% | +2.8% |
| Net MarginThe final take-home percentage. When you strip away every conceivable cost, tax, and interest payment, this is the exact number of cents the company truly gets to keep from every dollar in sales. | +8.2% | -32.3% | +34.8% |
| Free Cash FlowThe holy grail of corporate cash. It's the spendable, physical money left over after the business pays for its daily operations AND buys the big, expensive upgrades (like new factories or servers) it needs to survive. This is the 'free' money they can use to pay dividends or buy back stock. | $1.4B | +11.3% | +183.4% |
| FCF MarginThe ultimate cash conversion rate. It shows how good the company is at turning regular sales directly into cold, hard, spendable cash. A high percentage means the business is an absolute cash-printing machine. | +15.4% | -0.8% | +154.6% |
| Debt / EquityThe financial risk gauge. It compares how much of the company's empire was built using borrowed money (loans) versus the owners' own money (shareholders). A high number means they are heavily leveraged and playing a riskier game; a low number means they are playing it safe. | 483.7% | -5.7% | -3.0% |
| Current RatioThe 12-month survival check. It simply compares the cash they have right now (plus things they can quickly turn into cash) against the immediate bills they absolutely must pay this year. A score above 1 means they have enough in the wallet to cover the upcoming bills without panicking. | 0.98x | +1.4% | +2.4% |
| Total AssetsThe absolute size of the company's empire. It bundles together absolutely everything of value they own—from the cash in the register and the inventory in the warehouse, to the software patents in the vault and the factories on the ground. | $25.6B | +4.0% | +0.6% |
| Metric | Annual (A vs E) | Annual Surprise | Quarter (A vs E) | Quarter Surprise |
|---|---|---|---|---|
| EPS Surprise | 2.35 vs 3.68 | -36.1% | 1.45 vs 1.08 | +34.5% |
| Revenue Surprise | $9.4B vs $9.4B | +0.7% | $2.5B vs $2.5B | -0.6% |
| Date | Executive | Title | Security | Side | Shares | Price |
|---|---|---|---|---|---|---|
| Aug 21, 2026 | CURTIS THOMAS BENJAMIN | officer: Pres., BK US & CA | Common Shares | D | 64,000 | $80.72 |
| Aug 10, 2026 | 3G Restaurant Brands Holdings General Partner Ltd. | 10 percent owner | Exchangeable Units | A | 2,784,549 | — |
| Aug 10, 2026 | 3G Restaurant Brands Holdings General Partner Ltd. | 10 percent owner | Exchangeable Units | A | 2,000,183 | — |
| Jul 7, 2026 | Fulton Duncan | officer: Chief Corporate Officer | Performance Share Units | A | 214 | — |
| Jul 7, 2026 | Fulton Duncan | officer: Chief Corporate Officer | Performance Share Units | A | 195 | — |
Operator : Good morning, and welcome to Restaurant Brands International's Second Quarter 2026 Earnings Conference Call. [Operator Instructions] Please note, this event is being recorded. I would now like to turn the conference over to Kendall Peck, RBI's Vice President of Treasury and Investor Relations. Please go ahead. Kendall Peck : Thank you, operator. Good morning, everyone, and welcome to Restaurant Brands International's Earnings Call for the quarter ended June 30, 2026. Joining me on the call today are Restaurant Brands International's Executive Chairman, Patrick Doyle; CEO, Josh Kobza; and CFO, Sami Siddiqui. Following remarks from Josh, Samy and Patrick, we will open the call to questions. Today's discussion may include forward-looking statements, which are subject to risks detailed in the press release issued this morning and in our SEC filings. We will also reference non-GAAP financial measures, reconciliations of which can be found in the press release and trending schedules available on our website. As a reminder, organic adjusted operating income growth is on a constant currency basis and excludes results from the Restaurant Holdings segment. For calendar planning purposes, our preliminary Q3 earnings call is scheduled for the morning of October 29, 2026. And now I'll turn the call over to Josh. Joshua Kobza : Thank you, Kendall, and good morning, everyone. Q2 was another strong quarter. We delivered 3.8% same-store sales growth and 2.9% net restaurant growth, driving 6.4% system-wide sales growth, 6.7% organic adjusted operating income growth and 12.9% adjusted EPS growth. Last quarter, we said our results were early proof that the 2028 vision we laid out at our Investor Day was taking hold. Q2 built on that momentum. We accelerated same-store sales, exceeding our long-term 3% algorithm for the third consecutive quarter, delivered double-digit earnings growth and returned $435 million of capital to shareholders. We also advanced our other key priorities, strengthening our path to becoming an investment-grade company and making progress towards 5% net restaurant growth, all while being the partner of choice for the best franchisees and the employer of choice for the best talent. Just as importantly, our results highlight the strength of our diversified portfolio and disciplined operating model. By investing behind each of our brands while executing consistently against our long-term strategies, we've built a portfolio capable of delivering durable top line and earnings growth across a variety of consumer environments. Those strategies continue to drive results with Tim Hortons and International each delivering their 21st consecutive quarters of positive same-store sales growth. Burger King U.S. was a standout performer this quarter with our elevation strategy driving another major step forward in sales and expanding our outperformance versus the industry to the high single digits. I'm incredibly proud of what our teams and …
| Name | Title | Compensation | Gender | Year Born | Status |
|---|---|---|---|---|---|
Joshua Kobza | Chief Executive Officer | USD 2,841,868 | Male | 1987 | Active |
Axel Schwan | President of Tim Hortons - Canada & U.S. | USD 1,792,777 | Male | 1974 | Active |
Sami A. Siddiqui | Chief Financial Officer | USD 1,601,289 | Male | 1985 | Active |
Jill Granat | General Counsel & Corporate Secretary | USD 1,512,010 | Female | 1966 | Active |
Thomas Benjamin Curtis | President of Burger King U.S. & Canada | USD 1,117,739 | Male | 1964 | Active |
Jacqueline Friesner | Controller & Chief Accounting Officer | — | Female | 1973 | Active |
Duncan Stanley Allpress Fulton | Chief Corporate Officer | — | Male | 1977 | Active |
Jeff Housman | Chief People & Services Officer | — | Male | 1983 | Active |
Kendall Ardyce Peck | Head of Investor Relations | — | Male | — | Active |
J. Patrick Doyle | Executive Chairman | — | Male | 1963 | Active |
Company president said the revamped burger was helping win market share; McDonald's recently overhauled the Big Mac.
Restaurant Brands International Inc. (NYSE:QSR) reported a second-quarter earnings beat with adjusted EPS of $1.07, surpassing analyst expectations of $0.82.
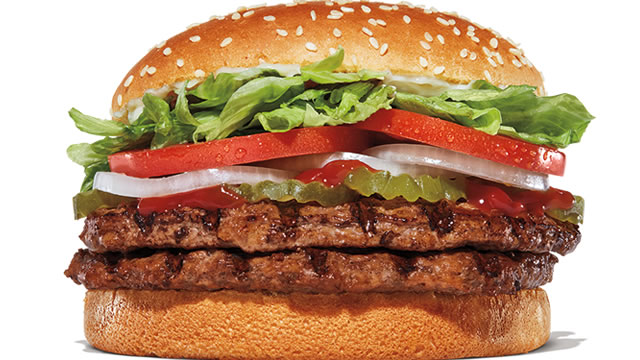
Burger King's US sales are soaring as customers embrace its revamped Whopper burger – while long-reigning McDonald's suffers flailing growth in its largest market.
Its performance may be volatile, but it's certainly working well enough right now.
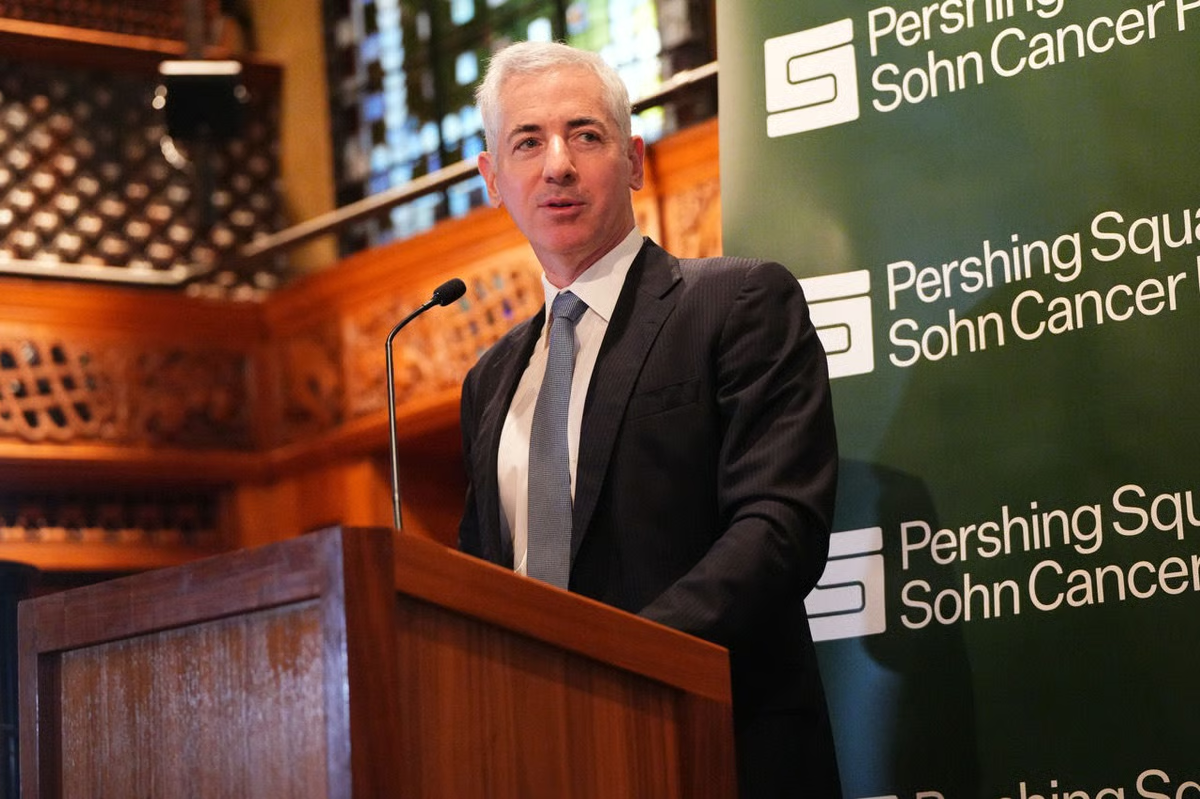
Restaurant Brands International (TSX:QSR, NYSE:QSR) reported second quarter 2026 adjusted earnings above Wall Street expectations on Thursday, supported by stronger comparable sales led by Burger King in the US. The company posted adjusted diluted earnings of $1.07 per share, above the $1.03 consensus estimate, while revenue of $2.52 billion was in line with expectations.