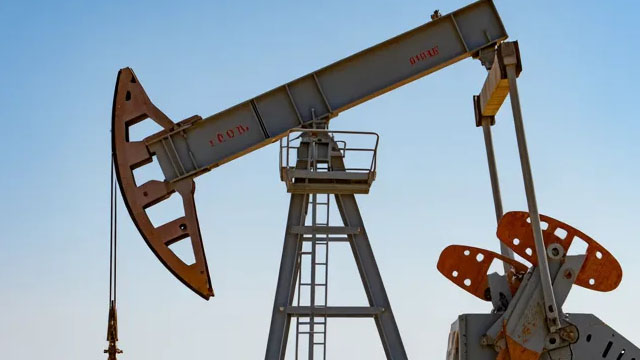
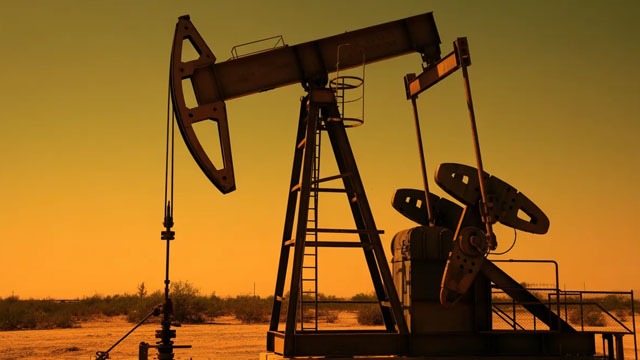
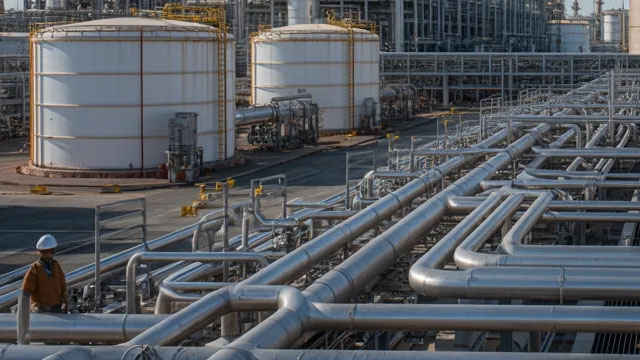
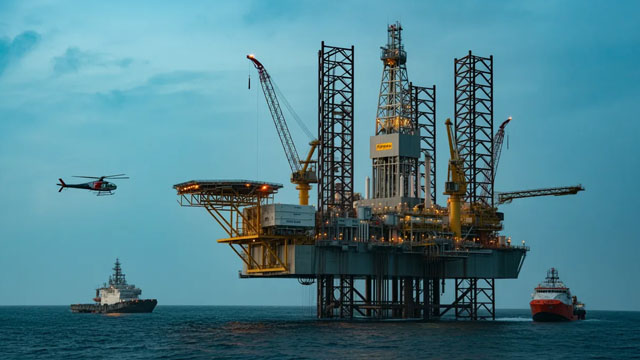
Based in Midland, Texas, ProPetro Holding Corp. is a dedicated provider of oilfield services. The company primarily specializes in hydraulic fracturing, offering ...
ProPetro Holding Corp. is an oilfield-services provider headquartered in Midland, Texas, at the center of the Permian Basin. The company was founded in 2005, while ProPetro Holding Corp. was formally organized as a Texas holding company in 2007. Its public shares began trading on the New York Stock Exchange under ...ProPetro Holding Corp. is an oilfield-services provider headquartered in Midland, Texas, at the center of the Permian Basin. The company was founded in 2005, while ProPetro Holding Corp. was formally organized as a Texas holding company in 2007. Its public shares began trading on the New York Stock Exchange under the ticker PUMP in March 2017. Samuel D. Sledge, also known as Sam Sledge, serves as chief executive officer and a director. The business is designed to support upstream oil and gas producers rather than explore for or own hydrocarbon reserves itself.
The company’s core activity is hydraulic fracturing, commonly called frac services. Hydraulic fracturing uses high-pressure pumps to inject fluid and proppant into drilled wells, creating and maintaining fractures that allow oil and natural gas to flow. ProPetro also offers complementary services such as cementing, acidizing, coiled tubing, and other well-completion and production-support activities. These offerings are organized primarily through a Pressure Pumping segment and an All Other segment. Its customer base consists mainly of North American exploration and production companies developing unconventional resources, particularly operators in the Permian Basin.
ProPetro’s cost structure is heavily influenced by labor, fuel, maintenance, equipment depreciation, replacement parts, transportation, insurance, and the capital required to maintain and upgrade its hydraulic-fracturing fleet. The company’s equipment base is a major component of its balance sheet and operating capability. Information supplied for 2021 described a fleet of 12 hydraulic-fracturing units with aggregate capacity of approximately 1,423,000 hydraulic horsepower. In addition to pumps, the business requires blending, hydration, sand-handling, data-monitoring, wireline, cementing, and other specialized field equipment. Capital expenditures can therefore be substantial and can affect free cash flow even when operating cash flow is positive.
The supplied trailing-period financial data indicated approximately $1.35 billion in market capitalization and $1.42 billion in enterprise value. Reported valuation metrics included an enterprise-value-to-EBITDA multiple of about 8.8 and an enterprise-value-to-sales multiple of about 1.2. The same data showed a current ratio above 4.0, reflecting substantial short-term liquidity, while profitability measures were slightly negative, including a net margin of approximately negative 1.2 percent and a return on equity of approximately negative 1.5 percent. The company paid no dividend in the supplied trailing period. Results are sensitive to customer drilling and completion budgets, utilization and pricing for pumping equipment, oil and gas commodity prices, labor availability, inflation, maintenance requirements, weather, and competition from larger oilfield-service providers.
With roughly 1,700 employees, ProPetro is categorized in the 1,001-to-2,000 employee range. Its strategic objective is to provide reliable, technologically capable, and cost-effective completion services while maintaining equipment utilization, safety, customer relationships, and financial discipline. Future growth depends on activity levels in the Permian Basin and other North American unconventional plays, fleet modernization, operational execution, contract quality, and the company’s ability to generate sustainable returns from its capital-intensive service platform.
YoYYoY means Year-over-Year. It compares the latest annual value with the previous annual value to show long-term trend strength.
QoQQoQ means Quarter-over-Quarter. It compares the latest quarter with the immediately previous quarter to show short-term momentum changes.
RevenueThe total money that came through the front door from selling things, before paying a single bill. Think of it as the grand total of every credit card swipe from customers. (YoY compares this year to last year's performance, while QoQ compares the current three months to the previous three).
$1.3B
-12.1%
+13.0%
Net IncomeThe absolute bottom line. If the company paid every single supplier, employee, banker, and tax collector, this is the actual money left in their pocket at the end of the day.
$824000
+100.6%
-122.7%
Gross MarginThe basic markup. If they sell a $100 pair of sneakers, this percentage tells you how much of that price tag is profit right after paying for the rubber and shoelaces, but before paying for things like store rent or TV commercials.
+9.9%
-14.1%
+36.6%
Operating MarginThe 'day job' efficiency score. Out of every dollar a customer spends, this shows how many cents the company keeps after making the product AND paying for all the everyday corporate overhead (like salaries, marketing, and keeping the lights on).
+1.5%
+112.6%
+51.9%
Net MarginThe final take-home percentage. When you strip away every conceivable cost, tax, and interest payment, this is the exact number of cents the company truly gets to keep from every dollar in sales.
+0.1%
+100.7%
-97.1%
Free Cash FlowThe holy grail of corporate cash. It's the spendable, physical money left over after the business pays for its daily operations AND buys the big, expensive upgrades (like new factories or servers) it needs to survive. This is the 'free' money they can use to pay dividends or buy back stock.
$42.5M
-62.1%
+114.2%
FCF MarginThe ultimate cash conversion rate. It shows how good the company is at turning regular sales directly into cold, hard, spendable cash. A high percentage means the business is an absolute cash-printing machine.
+3.3%
-56.8%
+112.6%
Debt / EquityThe financial risk gauge. It compares how much of the company's empire was built using borrowed money (loans) versus the owners' own money (shareholders). A high number means they are heavily leveraged and playing a riskier game; a low number means they are playing it safe.
30.0%
+39.6%
+373.4%
Current RatioThe 12-month survival check. It simply compares the cash they have right now (plus things they can quickly turn into cash) against the immediate bills they absolutely must pay this year. A score above 1 means they have enough in the wallet to cover the upcoming bills without panicking.
1.29x
-1.8%
+150.2%
Total AssetsThe absolute size of the company's empire. It bundles together absolutely everything of value they own—from the cash in the register and the inventory in the warehouse, to the software patents in the vault and the factories on the ground.
Operator: Good day, and welcome to the ProPetro Holding Corp. Second Quarter of 2026 Conference Call. Please note that this event is being recorded. I would now like to turn the call over to Matt Augustine, ProPetro's Vice President of Finance and Investor Relations. Please go ahead.
Matt Augustine: Thank you, and good morning. We appreciate your participation in today's call. With me are Chief Executive Officer, Sam Sledge; Chief Financial Officer, Caleb Weatherl; President and Chief Operating Officer, Adam Munoz; and President of PROPWR, Travis Simmering. This morning we released our earnings results for the second quarter of 2026. Please note that any comments we make on today's call regarding projections or our expectations for future events are forward-looking statements covered by the Private Securities Litigation Reform Act. Forward-looking statements are subject to several risks and uncertainties, many of which are beyond our control. These risks and uncertainties can cause actual results to differ materially from our current expectations. We advise listeners to review our earnings release and risk factors discussed in our filings with the SEC. Also during today's call, we will reference certain non-GAAP financial measures. Reconciliations of these non-GAAP measures to the most directly comparable GAAP measures are included in our earnings release. Finally, after our prepared remarks, we will hold a question and answer session. With that, I would like to turn the call over to Sam.
Sam Sledge: Thanks, Matt, and good morning, everyone. Our second quarter 2026 financial results once again demonstrated the strength of our business model. While our reported results were negatively impacted by a few items during the quarter, the underlying performance of the business remains strong, giving us confidence as we move through the third quarter. Our completions business generated resilient free cash flow again in the second quarter, which we believe is one of the clearest demonstrations that the industrialized model we've built is working. Our disciplined approach to capital deployment, operational efficiency, and cost management, paired with strategic actions we've taken over the past several years to optimize our asset base, continue to produce attractive cash flow and positions us well as the market conditions improve. We will continue leveraging the industrialized nature of our completions business to support the expansion of PROPWR while maintaining disciplined capital allocation across the enterprise. Now, let me quickly touch on some of the headwinds that impacted the quarter. During the second quarter, we increased our active fleet count from 11 to 12. As we've discussed previously, standing up a new fleet requires upfront maintenance and deployment costs before the full earnings benefit is realized. We also temporarily deployed an existing fleet outside of the Permian to support a limited-scope frac program for a long-standing customer. …