
Fool - Investing News8/26/2026Neutral
Bill Ackman Thinks This Factor Is Even More Important Than Valuation For Long-Term Investments
It's better to buy a wonderful business at a fair price than a fair business at a wonderful price.
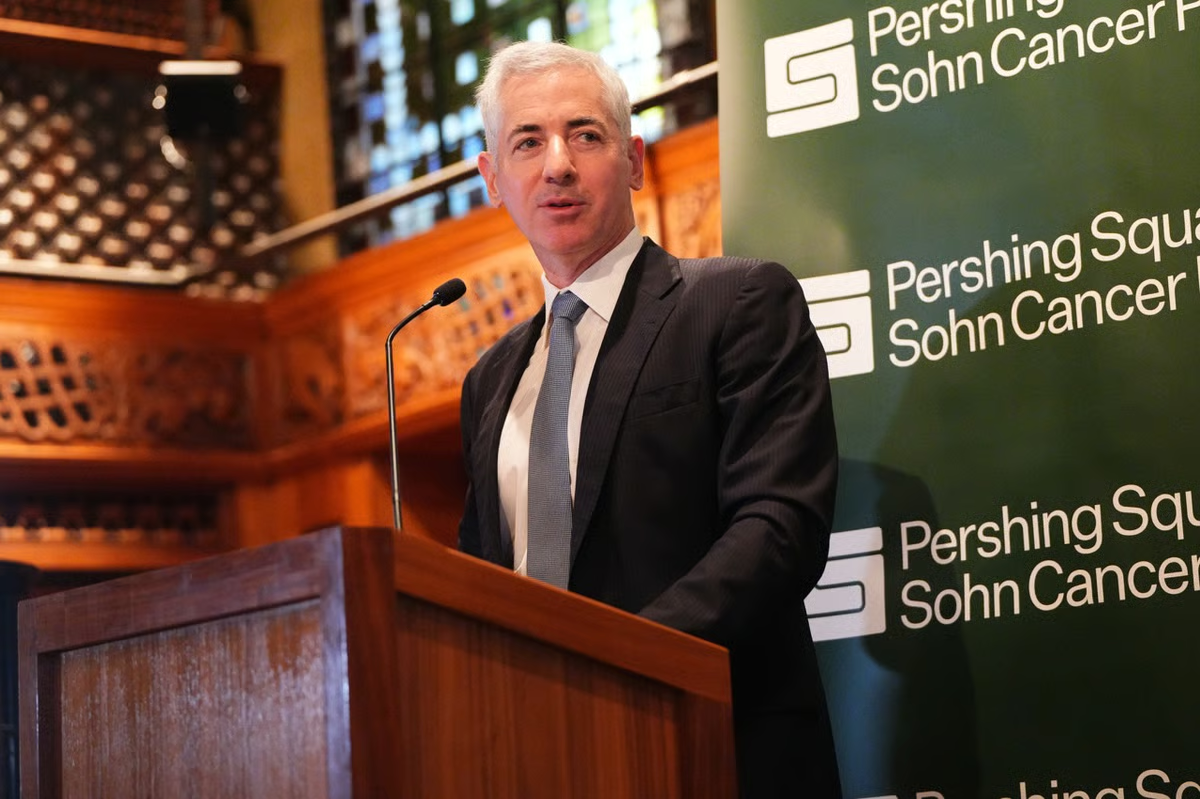
Pershing Square Inc., an alternative asset management firm, was established in 2024 and is headquartered in New York, New York. This entity ...
Plutux is not an investment adviser. Market data and AI-generated analysis are for information and education only, not investment advice. Disclaimer
Est. EPS $0.53 · Revenue $306.69M · 4 analysts
Est. EPS $0.18 · Revenue $105.77M · 1 analysts
Est. EPS $0.45 · Revenue $235.78M · 1 analysts
Est. EPS $0.97 · Revenue $548.16M · 4 analysts
$0.00 per share
$0.00 per share
EPS $-0.53 · Revenue $750.01M
| Metric | Latest | YoYYoY means Year-over-Year. It compares the latest annual value with the previous annual value to show long-term trend strength. | QoQQoQ means Quarter-over-Quarter. It compares the latest quarter with the immediately previous quarter to show short-term momentum changes. |
|---|---|---|---|
| RevenueThe total money that came through the front door from selling things, before paying a single bill. Think of it as the grand total of every credit card swipe from customers. (YoY compares this year to last year's performance, while QoQ compares the current three months to the previous three). | $750.0M | — | -5.8% |
| Net IncomeThe absolute bottom line. If the company paid every single supplier, employee, banker, and tax collector, this is the actual money left in their pocket at the end of the day. | $-210.1M | — | +71.1% |
| Gross MarginThe basic markup. If they sell a $100 pair of sneakers, this percentage tells you how much of that price tag is profit right after paying for the rubber and shoelaces, but before paying for things like store rent or TV commercials. | +94.6% | — | -201.6% |
| Operating MarginThe 'day job' efficiency score. Out of every dollar a customer spends, this shows how many cents the company keeps after making the product AND paying for all the everyday corporate overhead (like salaries, marketing, and keeping the lights on). | -47.2% | — | -1444.9% |
| Net MarginThe final take-home percentage. When you strip away every conceivable cost, tax, and interest payment, this is the exact number of cents the company truly gets to keep from every dollar in sales. | -28.0% | — | +69.3% |
| Free Cash FlowThe holy grail of corporate cash. It's the spendable, physical money left over after the business pays for its daily operations AND buys the big, expensive upgrades (like new factories or servers) it needs to survive. This is the 'free' money they can use to pay dividends or buy back stock. | $-134.7M | — | -71.1% |
| FCF MarginThe ultimate cash conversion rate. It shows how good the company is at turning regular sales directly into cold, hard, spendable cash. A high percentage means the business is an absolute cash-printing machine. | -18.0% | — | -69.3% |
| Debt / EquityThe financial risk gauge. It compares how much of the company's empire was built using borrowed money (loans) versus the owners' own money (shareholders). A high number means they are heavily leveraged and playing a riskier game; a low number means they are playing it safe. | 16.2% | — | +176.4% |
| Current RatioThe 12-month survival check. It simply compares the cash they have right now (plus things they can quickly turn into cash) against the immediate bills they absolutely must pay this year. A score above 1 means they have enough in the wallet to cover the upcoming bills without panicking. | 7.02x | — | — |
| Total AssetsThe absolute size of the company's empire. It bundles together absolutely everything of value they own—from the cash in the register and the inventory in the warehouse, to the software patents in the vault and the factories on the ground. | $2.8B | — | +83.0% |
| Metric | Annual (A vs E) | Annual Surprise | Quarter (A vs E) | Quarter Surprise |
|---|---|---|---|---|
| EPS Surprise | -0.53 vs 0.21 | -357.1% | -0.11 vs 0.18 | -161.1% |
| Revenue Surprise | $750.0M vs $767.7M | -2.3% | $54.2M vs $105.8M | -48.8% |
Operator: Good day, and welcome to the Pershing Square 2026 Second Quarter Earnings Call. Today's call is being recorded. [Operator Instructions] It is now my pleasure to turn the conference over to Jill Chapman, Head of Corporate Investor Relations for Pershing Square. Jill Chapman: Thank you, Tara. Good morning, everyone, and welcome to Pershing's Second Quarter 2026 Earnings Call. Joining me today are CEO and Chairman, Bill Ackman; and CIO, Ryan Israel. Yesterday evening, we issued our earnings presentation and letter to shareholders, which are available on our website at pershingsquareinc.com under the Investors section. We expect to file our 10-Q after market close today. Before we begin, I would like to draw your attention to the legal disclaimers at the end of our earnings presentation. Today's call may include forward-looking statements, which involve risks and uncertainties and are not guarantees of future performance. Actual results may differ materially from those expressed or implied in the forward-looking statements due to a variety of factors described under forward-looking statements in our earnings presentation and IPO prospectus filed on April 30 as updated by our most recently filed Form 10-Q. We do not undertake any obligation to update forward-looking statements. We may also reference non-GAAP financial measures in response to questions. Reconciliations are included in our earnings presentation available on our website. Finally, please note that nothing on this call constitutes a prospectus, an offer to sell or a solicitation of an offer to purchase our common stock or any interest or security in any Pershing Square fund or securities of any other person. Furthermore, nothing on this call constitutes investment advice or an invitation or inducement to deal in securities. And with that, I would like to turn the call over to Bill Ackman. William Ackman: Thank you, Jill. Welcome to our first earnings call for Pershing Square, Inc. One of the -- we spent the last 22 years listening to other people's conference calls, and we learned from that, which is why we've taken the approach of the night before releasing earnings, releasing a detailed letter kind of covering what we think are kind of the key issues and considerations for the quarter, leaving the full hour for questions from analysts, shareholders, other investors. We're going to follow this call with a Space on X. If you go to X, you can find the link. We're also posting that effectively, replaying it. You'll be able to listen to it afterwards. Expect that discussion to be more focused on the kind of the underlying investments in the Pershing Square portfolio, and then we're happy to take some of those questions now. But the emphasis on our underlying holdings, one of the points we tried to make in the letter, what's interesting about this company is that if we never raise another investment vehicle, we just sit with the three permanent capital vehicles we have today. This …
| Name | Title | Compensation | Gender | Year Born | Status |
|---|---|---|---|---|---|
William Albert Ackman | CEO & Chairman of the Board of Pershing Square Holdco GP, LLC and Founder | USD 142,775,160 | Male | 1966 | Active |
Ryan Michael Israel | Chief Investment Officer & Director of Pershing Square Holdco GP, LLC | USD 44,045,910 | Male | 1985 | Active |
Ben Hakim | President & Executive Director of Pershing Square Holdco GP, LLC | USD 17,771,413 | Male | — | Active |
Halit Coussin | Chief Legal Officer, Chief Compliance Officer & Director of Pershing Square Holdco GP, LLC | — | Female | 1973 | Active |
Michael Gonnella | Chief Financial Officer of Pershing Square Holdco GP, LLC | — | Male | 1981 | Active |
It's better to buy a wonderful business at a fair price than a fair business at a wonderful price.
The high-profile investor believes the company is crushing it in two key areas of its business.
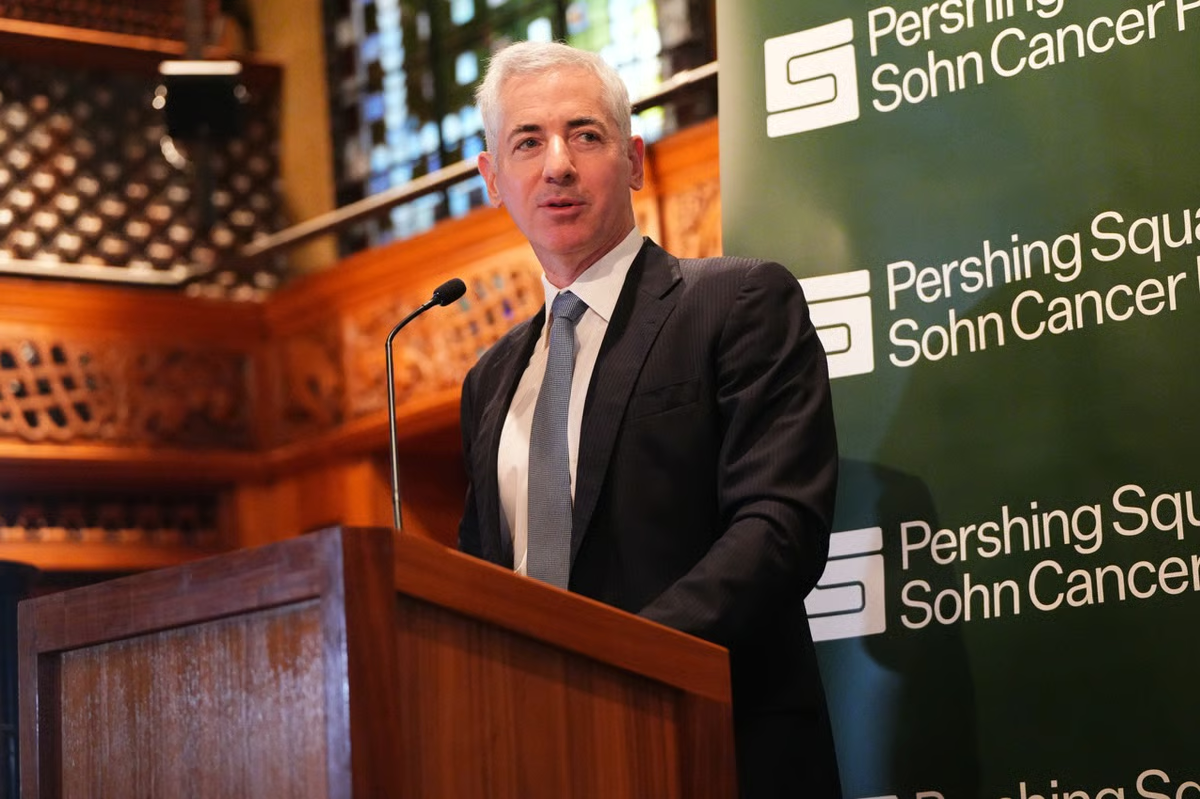
Ackman has created two new sources of capital to invest in for Pershing Square. He exited several positions last quarter and used the proceeds to invest in new opportunities.

The next fund from Pershing Square could be complementary to its current options.
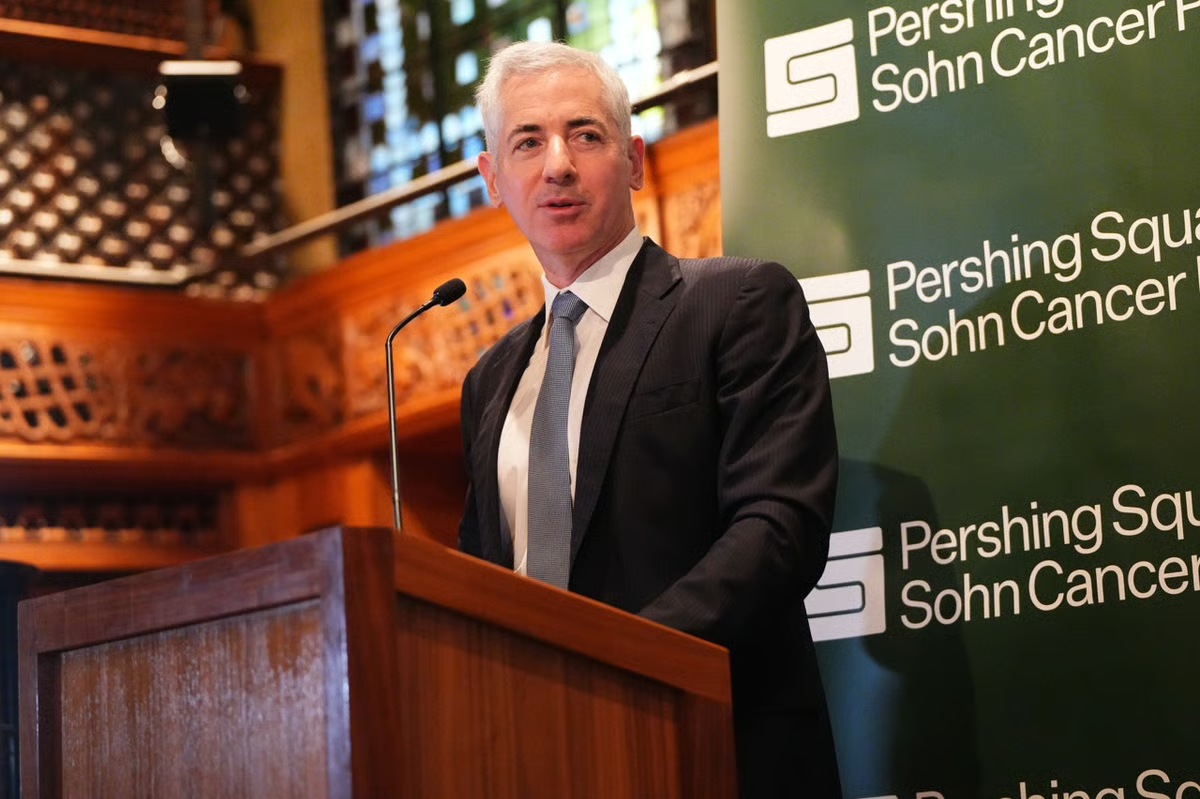
Investors looking for stocks in the Financial - Investment Management sector might want to consider either Ameriprise Financial Services (AMP) or Pershing Square (PS). But which of these two companies is the best option for those looking for undervalued stocks?