Pool Corporation, established in 1993 and based in Covington, Louisiana, serves as a leading wholesale distributor of swimming pool essentials, outdoor living ...
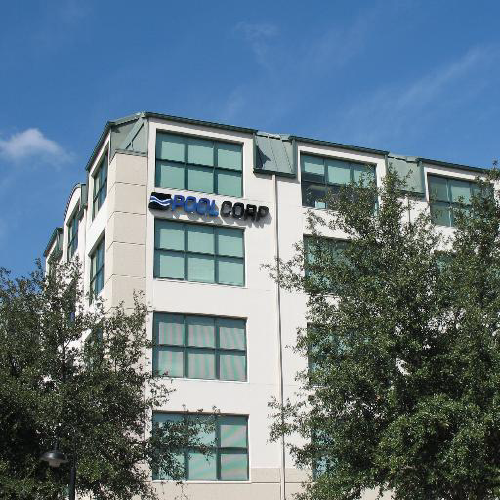
Pool Corporation (NASDAQ: POOL), commonly known as POOLCORP, is a leading wholesale distributor in the swimming pool and outdoor living industry. Established in 1980 by Frank J. St. Romain in New Orleans, Louisiana, the company has grown from a small supply and construction firm into the world's largest distributor of ...Pool Corporation (NASDAQ: POOL), commonly known as POOLCORP, is a leading wholesale distributor in the swimming pool and outdoor living industry. Established in 1980 by Frank J. St. Romain in New Orleans, Louisiana, the company has grown from a small supply and construction firm into the world's largest distributor of pool and related products. Headquartered in Covington, Louisiana, POOLCORP operates around 455 sales centers across North America, Europe, and Australia, supported by over 6,000 employees. As of the latest financial data, the company has a market capitalization of approximately $7.5 billion and trades on the NASDAQ Global Select exchange.
The company's comprehensive product portfolio includes swimming pool chemicals, cleaning supplies, maintenance equipment, replacement parts for pumps, heaters, filters, and lighting, as well as structural elements like fiberglass pools, spas, and pre-packaged pool kits for both in-ground and above-ground installations. Additionally, POOLCORP offers irrigation systems, landscape products, construction materials such as concrete, plumbing and electrical supplies, pool finishes, decking, tiles, and natural stone. The company also provides commercial-grade products for hospitality, educational, and public recreational facilities, as well as outdoor living items like barbecues and custom outdoor kitchen modules.
Financially, POOLCORP demonstrates strong performance with a gross profit margin of 29.6% and a net profit margin of 7.4%. The company has a price-to-earnings ratio of 18.9 and a debt-to-equity ratio of 1.35, indicating moderate leverage. Its return on equity is robust at 32.3%, and it pays a dividend with a yield of 2.4%. The company generates significant free cash flow, with a free cash flow per share of $16.86.
Key leadership includes Peter D. Arvan as President and CEO, and John E. Stokely as a key figure, though the current CEO is John Bruce Watwood, who was named President and CEO in May 2026 (though the provided data lists him as CEO). The company was founded by Frank St. Romain, whose entrepreneurial spirit laid the foundation for its growth.
POOLCORP serves a diverse clientele, including pool construction and renovation firms, independent pool retailers, repair and maintenance businesses, irrigation and landscaping professionals, and institutional customers. With a vast distribution network and a broad product range, the company is well-positioned to meet the demands of the growing pool and outdoor living market.
YoYYoY means Year-over-Year. It compares the latest annual value with the previous annual value to show long-term trend strength.
QoQQoQ means Quarter-over-Quarter. It compares the latest quarter with the immediately previous quarter to show short-term momentum changes.
RevenueThe total money that came through the front door from selling things, before paying a single bill. Think of it as the grand total of every credit card swipe from customers. (YoY compares this year to last year's performance, while QoQ compares the current three months to the previous three).
$5.3B
-0.4%
+60.2%
Net IncomeThe absolute bottom line. If the company paid every single supplier, employee, banker, and tax collector, this is the actual money left in their pocket at the end of the day.
$406.4M
-6.4%
+253.4%
Gross MarginThe basic markup. If they sell a $100 pair of sneakers, this percentage tells you how much of that price tag is profit right after paying for the rubber and shoelaces, but before paying for things like store rent or TV commercials.
+29.7%
+0.2%
+2.3%
Operating MarginThe 'day job' efficiency score. Out of every dollar a customer spends, this shows how many cents the company keeps after making the product AND paying for all the everyday corporate overhead (like salaries, marketing, and keeping the lights on).
+11.0%
-5.6%
+102.3%
Net MarginThe final take-home percentage. When you strip away every conceivable cost, tax, and interest payment, this is the exact number of cents the company truly gets to keep from every dollar in sales.
+7.7%
-6.0%
+120.6%
Free Cash FlowThe holy grail of corporate cash. It's the spendable, physical money left over after the business pays for its daily operations AND buys the big, expensive upgrades (like new factories or servers) it needs to survive. This is the 'free' money they can use to pay dividends or buy back stock.
$309.5M
-48.4%
-112.1%
FCF MarginThe ultimate cash conversion rate. It shows how good the company is at turning regular sales directly into cold, hard, spendable cash. A high percentage means the business is an absolute cash-printing machine.
+5.9%
-48.2%
-107.5%
Debt / EquityThe financial risk gauge. It compares how much of the company's empire was built using borrowed money (loans) versus the owners' own money (shareholders). A high number means they are heavily leveraged and playing a riskier game; a low number means they are playing it safe.
129.5%
+29.7%
-4.2%
Current RatioThe 12-month survival check. It simply compares the cash they have right now (plus things they can quickly turn into cash) against the immediate bills they absolutely must pay this year. A score above 1 means they have enough in the wallet to cover the upcoming bills without panicking.
2.24x
+9.3%
+42.7%
Total AssetsThe absolute size of the company's empire. It bundles together absolutely everything of value they own—from the cash in the register and the inventory in the warehouse, to the software patents in the vault and the factories on the ground.
Operator : Good day, and welcome to the Pool Corporation Second Quarter 2026 Conference Call. Please also note today's event is being recorded. I'd now like to turn the conference over to Kristin Byars, Director of Investor Relations. Please go ahead.
Kristin Byars : Welcome to our second quarter 2026 earnings conference call. During today's call, our discussion, comments and responses to questions may include forward-looking statements, including management's outlook for 2026 and future periods. Actual results may differ materially from those discussed today. Information regarding the factors and variables that could cause actual results to differ from projected results are discussed in our 10-K. In addition, we may make references to non-GAAP financial measures in our comments. A description, reconciliation of non-GAAP financial measures are included in our press release or posted on our corporate website in the Investor Relations section. Additionally, we have provided a presentation summarizing key points from our press release and today's call, which can also be found on our Investor Relations website. I am now pleased to introduce John Watwood, our President and CEO, who will begin today's call.
John Watwood : Thanks, Kristin. Good morning, everyone and thank you for joining our call. Before we cover the first -- the quarter, I first want to thank our employees for their tireless efforts and their dedication to our customers day in and day out, especially during these critical pool season months. I also want to take a moment as this is my first earnings call as POOLCORP's CEO, to share my perspective on our business and where we are headed. I came into POOLCORP with a deep appreciation for what makes distribution businesses successful, branch level execution, strong supplier partnerships, technical sales expertise, disciplined inventory and service level management and seamless coordination across local markets. These capabilities have supported POOLCORP's value proposition for more than 30 years and provide us a strong foundation for continued growth. Additionally, the structural drivers of POOLCORP's business model are powerful, a large installed base of pools that naturally grows each year and generates recurring revenues from ongoing maintenance and periodic remodel activities, a professional customer base that depends on our scale and service and a distribution network that is difficult to replicate. With our eyes set on crisp execution, I believe we can continue to generate above-market growth and control how we respond to any type of industry backdrop. Our fundamental strategy is unchanged. We aim to be the best worldwide distributor of outdoor lifestyle products by growing our share worth of customers, building density in our network and executing consistently across every market we serve. Our products must be on the shelves when the customer walks in the door and when it comes down to service, supplier relationships and …