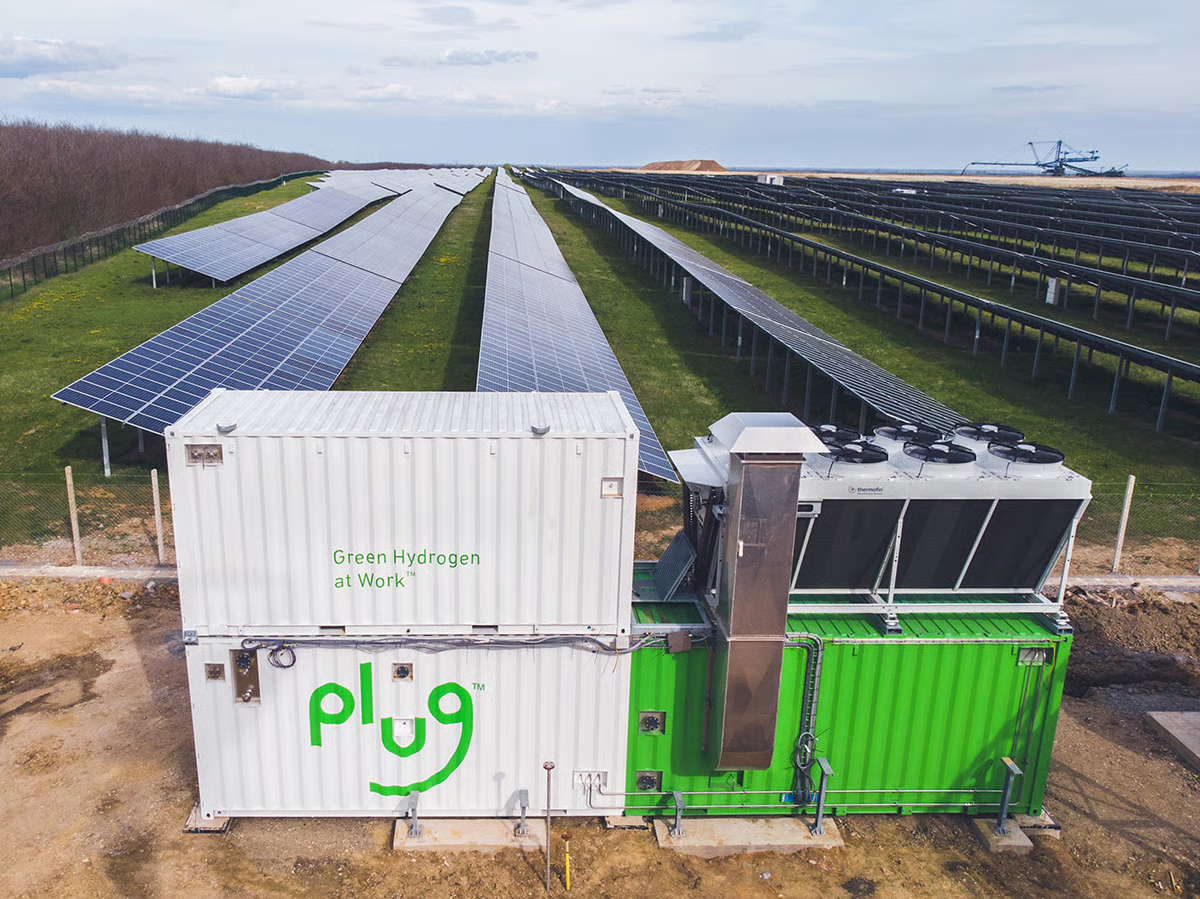
Plug Power Inc. specializes in providing comprehensive clean hydrogen and zero-emission fuel cell solutions. These innovative offerings cater to various sectors, including ...
Plug Power Inc., headquartered in Latham, New York, is a pioneer in the hydrogen economy, established in 1997 and publicly traded since 1999 (NASDAQ: PLUG). The company specializes in designing, manufacturing, and selling hydrogen fuel cell systems and electrolyzers that replace conventional batteries in various applications, including material handling, on-road ...Plug Power Inc., headquartered in Latham, New York, is a pioneer in the hydrogen economy, established in 1997 and publicly traded since 1999 (NASDAQ: PLUG). The company specializes in designing, manufacturing, and selling hydrogen fuel cell systems and electrolyzers that replace conventional batteries in various applications, including material handling, on-road electric vehicles, and stationary power. Plug Power is building an integrated green hydrogen ecosystem, encompassing hydrogen production via its PEM electrolyzers, liquefaction, storage, transportation, and dispensing, as well as fuel cell power generation. Its product portfolio includes GenDrive (fuel cell systems for forklifts), GenFuel (hydrogen fueling infrastructure), GenCare (IoT-based service and maintenance), GenSure (stationary power solutions), GenKey (turnkey solutions), ProGen (fuel cell stacks and engines for mobility), and GenFuel Electrolyzers for clean hydrogen production. The company serves various sectors such as supply chain, logistics, transportation, and utilities, with operations in North America and international markets. Plug Power has established strategic partnerships with major entities like Airbus, Lhyfe, Edison Motors, Phillips 66, Apex Clean Energy, BAE Systems, and Universal Hydrogen Co. Despite strong revenue growth potential, the company has faced financial challenges, reporting negative gross profit and net losses in recent fiscal years, with a market cap of approximately $3.04 billion as of the latest data. The company is led by CEO Jose Luis Crespo, who took over in March 2026 after Andy Marsh's long tenure. Plug Power employs around 2,582 full-time employees and continues to drive innovations in clean energy.
YoYYoY means Year-over-Year. It compares the latest annual value with the previous annual value to show long-term trend strength.
QoQQoQ means Quarter-over-Quarter. It compares the latest quarter with the immediately previous quarter to show short-term momentum changes.
RevenueThe total money that came through the front door from selling things, before paying a single bill. Think of it as the grand total of every credit card swipe from customers. (YoY compares this year to last year's performance, while QoQ compares the current three months to the previous three).
$709.9M
+12.9%
+9.0%
Net IncomeThe absolute bottom line. If the company paid every single supplier, employee, banker, and tax collector, this is the actual money left in their pocket at the end of the day.
$-1.6B
+22.5%
+23.3%
Gross MarginThe basic markup. If they sell a $100 pair of sneakers, this percentage tells you how much of that price tag is profit right after paying for the rubber and shoelaces, but before paying for things like store rent or TV commercials.
-34.1%
+65.7%
+92.9%
Operating MarginThe 'day job' efficiency score. Out of every dollar a customer spends, this shows how many cents the company keeps after making the product AND paying for all the everyday corporate overhead (like salaries, marketing, and keeping the lights on).
-95.7%
+70.2%
+43.4%
Net MarginThe final take-home percentage. When you strip away every conceivable cost, tax, and interest payment, this is the exact number of cents the company truly gets to keep from every dollar in sales.
-229.8%
+31.3%
+29.6%
Free Cash FlowThe holy grail of corporate cash. It's the spendable, physical money left over after the business pays for its daily operations AND buys the big, expensive upgrades (like new factories or servers) it needs to survive. This is the 'free' money they can use to pay dividends or buy back stock.
$-661.5M
+37.8%
+36.5%
FCF MarginThe ultimate cash conversion rate. It shows how good the company is at turning regular sales directly into cold, hard, spendable cash. A high percentage means the business is an absolute cash-printing machine.
-93.2%
+44.9%
+41.8%
Debt / EquityThe financial risk gauge. It compares how much of the company's empire was built using borrowed money (loans) versus the owners' own money (shareholders). A high number means they are heavily leveraged and playing a riskier game; a low number means they are playing it safe.
102.0%
+63.9%
+5.0%
Current RatioThe 12-month survival check. It simply compares the cash they have right now (plus things they can quickly turn into cash) against the immediate bills they absolutely must pay this year. A score above 1 means they have enough in the wallet to cover the upcoming bills without panicking.
2.31x
+17.0%
-1.6%
Total AssetsThe absolute size of the company's empire. It bundles together absolutely everything of value they own—from the cash in the register and the inventory in the warehouse, to the software patents in the vault and the factories on the ground.
Operator: Greetings, and welcome to the Plug Power Second Quarter 26 Earnings Conference Call and Webcast. At this time, participants are in a listen-only mode. A question-and-answer session will follow the formal presentation. As a reminder, this conference is being recorded. it is now my pleasure to turn the call over to Vice President of Marketing Communications, Teal Hoyos. Please go ahead, Thank you.
Teal Vivacqua Hoyos: Welcome to the 2026 second quarter earnings call. This call will include forward-looking statements. These forward-looking statements contain projections of future results of operations or of our financial position or other forward-looking information. We intend these forward-looking statements to be covered by the Safe Harbor provisions for forward-looking statements contained in Section 27A of the Securities Act of 1.93 thousand and Section 21E of the Securities Exchange Act of 1.93 thousand. We believe that it is important to communicate our future expectations to investors However, investors are cautioned not to unduly rely on forward-looking statements. And such statements should not be read or understood as a guarantee of future performance or results. Such statements are subject to risks and uncertainties that could cause actual results or performance to differ materially from those discussed as a result of various factors, including, but not limited to, risks and uncertainties discussed under Item 1A Risk Factors in our Annual Report on Form 10 for the fiscal year ending 12/31/2025. or quarterly reports on Form 10 Q for the quarter ending 03/31/2026. As well as other reports we file from time to time with the SEC. These forward-looking statements speak only of the day that the statements are made we do not undertake or intend to update any forward-looking statements after this call or as a result of new information. At this point, I would like to turn the call over to Plug's CEO, Jose Luis Crespo.
Jose Luis Crespo: Good afternoon, everyone, and thank you for joining our second earnings call of 2026. And also thank you for your continued confidence in the Plug team. Q2 was a strong step forward. And is giving us real conviction about the rest of the year. We are executing our numbers are moving in the right direction across the board and today we are raising our full year revenue growth guidance as a result. Paul will walk through the financial details in a moment, let me start with why we are excited. Revenue was $178 million in the second quarter. Up approximately 9% sequentially from the first quarter. This is continued proof that our commercial engine is accelerating. Gross margin improved to approximately breakeven It was about -0.9%. Compared to a -30.7% a year ago and a -13% just last quarter. that is a meaningful step in a single quarter and it is the direct result of the operational discipline we have built into Quantum Leap, which is our restructuring program, combined with improving service margins and …