Pangaea Logistics Solutions, Ltd., along with its subsidiary companies, offers specialized global seaborne transportation and logistics services for dry bulk commodities to ...
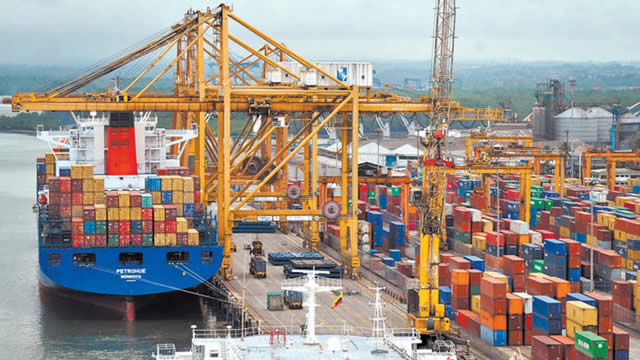
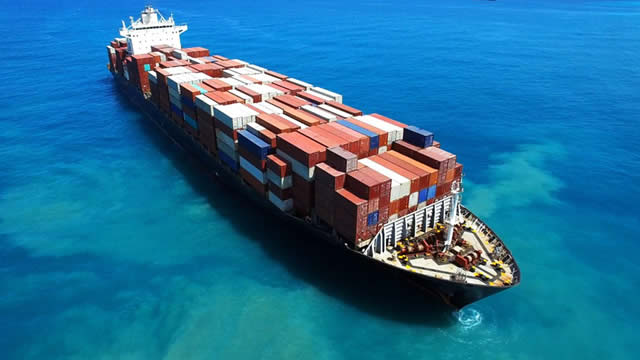
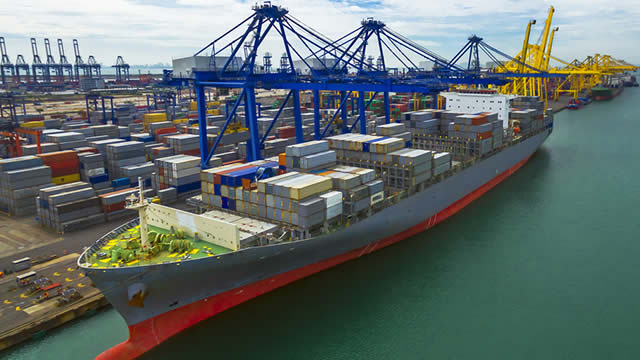
Pangaea Logistics Solutions, Ltd., headquartered in Newport, Rhode Island, is a global provider of comprehensive maritime logistics and transportation solutions. The company specializes in the seaborne transportation of a wide variety of dry bulk cargoes, including grains, coal, iron ore, pig iron, hot briquetted iron, bauxite, alumina, cement clinker, dolomite, ...Pangaea Logistics Solutions, Ltd., headquartered in Newport, Rhode Island, is a global provider of comprehensive maritime logistics and transportation solutions. The company specializes in the seaborne transportation of a wide variety of dry bulk cargoes, including grains, coal, iron ore, pig iron, hot briquetted iron, bauxite, alumina, cement clinker, dolomite, and limestone. Pangaea offers a full suite of marine logistics services, encompassing cargo handling (loading and discharge), vessel chartering, meticulous voyage planning, and technical vessel management. As of March 16, 2022, the company owned and operated a fleet of 25 vessels, though other reports indicate a fleet size of 7, suggesting possible variations over time. Founded in 1996, the company has established a strong presence in the industry, particularly in the Arctic and ice trade, leveraging its ice-class vessels to navigate challenging routes. Pangaea's business model focuses on providing integrated logistics solutions to industrial clients, ensuring efficient and reliable transportation of their raw materials. The company's revenue is primarily derived from freight and chartering activities, with a focus on optimizing vessel utilization and operational efficiency. Financially, Pangaea has demonstrated resilience, with a market capitalization of approximately $485 million as of the latest data, and a price-to-earnings ratio of 13.56, indicating a reasonable valuation. The company's profitability metrics, such as a net profit margin of 5.1%, reflect a stable but modest performance in the cyclical dry bulk shipping industry. Pangaea's leadership, under CEO Mads Rosenberg Boye Petersen, emphasizes strategic growth, operational excellence, and customer satisfaction. With a dedicated team of around 170 employees, the company maintains a lean yet effective organizational structure. Pangaea is committed to sustainability and safety, adhering to stringent environmental regulations and industry standards. The company's long-term vision includes expanding its fleet and enhancing its service offerings to meet evolving market demands, while maintaining a strong focus on shareholder value and corporate governance.
YoYYoY means Year-over-Year. It compares the latest annual value with the previous annual value to show long-term trend strength.
QoQQoQ means Quarter-over-Quarter. It compares the latest quarter with the immediately previous quarter to show short-term momentum changes.
RevenueThe total money that came through the front door from selling things, before paying a single bill. Think of it as the grand total of every credit card swipe from customers. (YoY compares this year to last year's performance, while QoQ compares the current three months to the previous three).
$632.0M
+17.8%
+9.7%
Net IncomeThe absolute bottom line. If the company paid every single supplier, employee, banker, and tax collector, this is the actual money left in their pocket at the end of the day.
$19.4M
-33.0%
-23.3%
Gross MarginThe basic markup. If they sell a $100 pair of sneakers, this percentage tells you how much of that price tag is profit right after paying for the rubber and shoelaces, but before paying for things like store rent or TV commercials.
+10.9%
-19.8%
+86.9%
Operating MarginThe 'day job' efficiency score. Out of every dollar a customer spends, this shows how many cents the company keeps after making the product AND paying for all the everyday corporate overhead (like salaries, marketing, and keeping the lights on).
+6.0%
-33.5%
+79.8%
Net MarginThe final take-home percentage. When you strip away every conceivable cost, tax, and interest payment, this is the exact number of cents the company truly gets to keep from every dollar in sales.
+3.1%
-43.1%
-30.0%
Free Cash FlowThe holy grail of corporate cash. It's the spendable, physical money left over after the business pays for its daily operations AND buys the big, expensive upgrades (like new factories or servers) it needs to survive. This is the 'free' money they can use to pay dividends or buy back stock.
$47.2M
+1362.7%
+700.5%
FCF MarginThe ultimate cash conversion rate. It shows how good the company is at turning regular sales directly into cold, hard, spendable cash. A high percentage means the business is an absolute cash-printing machine.
+7.5%
+1171.9%
+629.8%
Debt / EquityThe financial risk gauge. It compares how much of the company's empire was built using borrowed money (loans) versus the owners' own money (shareholders). A high number means they are heavily leveraged and playing a riskier game; a low number means they are playing it safe.
86.7%
-6.7%
-4.6%
Current RatioThe 12-month survival check. It simply compares the cash they have right now (plus things they can quickly turn into cash) against the immediate bills they absolutely must pay this year. A score above 1 means they have enough in the wallet to cover the upcoming bills without panicking.
1.69x
-4.2%
-15.3%
Total AssetsThe absolute size of the company's empire. It bundles together absolutely everything of value they own—from the cash in the register and the inventory in the warehouse, to the software patents in the vault and the factories on the ground.
Operator: Good morning. My name is Erica, and I will be your conference operator today. At this time, I would like to welcome everyone to the Pangaea Logistics Solutions Second Quarter 2026 Results Conference Call. Today's call is being recorded and will be available for replay beginning at 11:00 a.m. Eastern. The recording can be accessed by dialing (800) 925-9941 for domestic or (402) 220-5395 for international. [Operator Instructions] It is now my pleasure to turn the floor over to Stefan Neely with Vallum Advisors. Please go ahead.
Stefan Neely: Thank you, operator, and welcome to the Pangaea Logistics Solutions Second Quarter 2026 Results Conference Call. Leading the call with me today are CEO, Mads Petersen; and Chief Financial Officer, Gianni Del Signore. Today's discussion contains forward-looking statements about future business and financial expectations. Actual results may differ significantly from those projected in today's forward-looking statements due to various risks and uncertainties, including the risks described in our periodic reports filed with the SEC. Except as required by law, we undertake no obligation to update our forward-looking statements. At the conclusion of our prepared remarks, we will open the line for questions. With that, I would like to turn the call over to Mads.
Mads Petersen: Thank you, Stefan, and welcome to those joining us on the call today. We generated strong results in both revenue and profitability during the second quarter. Our financial performance was driven by strong execution across both our owned and chartered-in fleet as well as balanced positioning of our assets to take advantage of stronger overall demand, especially in Asia. Robust markets contributed to a 50% increase in our TCE rates for the second quarter. Notably, our TCE rates averaged 10% above the prevailing market for the Panamax, Supramax and Handysize indices. This premium reflects the benefits of our fleet positioning strategy, the value of our operating platform, long-standing customer relationships and ability to manage a volatile market effectively. We generated significant operating leverage from the favorable market environment with second [ year ] quarter adjusted EBITDA growing by nearly $20 million year-over-year to $35 million. Just as important, these results highlight the value of the business model, which allows us to protect and, in many cases, expand our margins in dynamic market environments. We actively managed volatile fuel markets through hedging and contract terms, while our continued focus on fleet positioning and backhaul trades allowed us to capture arbitrage opportunities. Our balanced approach to fleet deployment, including a greater concentration of vessels in the Pacific region contributed positively and our increased exposure to shorter-term time charters enabled us to benefit from positive developments in our core Atlantic markets. Strong execution across our chartered-in business underscores our …