Maiden Holdings Ltd. offers personalized reinsurance services and products, specifically excluding high-impact catastrophic events, to insurance companies ranging from small to medium ...
Maiden Holdings, Ltd. is a specialty insurance and reinsurance organization established in 2007 and headquartered in Bermuda, with the supplied operating address in Mount Laurel, New Jersey. The company’s core business has historically focused on providing tailored reinsurance capacity to insurance carriers, particularly small and medium-sized insurers. Reinsurance allows a ...Maiden Holdings, Ltd. is a specialty insurance and reinsurance organization established in 2007 and headquartered in Bermuda, with the supplied operating address in Mount Laurel, New Jersey. The company’s core business has historically focused on providing tailored reinsurance capacity to insurance carriers, particularly small and medium-sized insurers. Reinsurance allows a primary insurer to transfer part of its underwriting risk to Maiden in exchange for premiums. Maiden’s stated strategy has emphasized customized, non-catastrophic property and casualty programs, excluding or limiting exposure to high-impact catastrophe events. This focus is intended to support more predictable loss experience than a portfolio heavily concentrated in hurricanes, earthquakes, or other major natural disasters, although underwriting, reserve, credit, investment, and counterparty risks remain significant.
The company has reported two principal operating areas: Diversified Reinsurance and AmTrust Reinsurance. Diversified Reinsurance encompasses a range of property and casualty reinsurance contracts across multiple lines and counterparties. AmTrust Reinsurance relates to business transferred from AmTrust to Maiden Bermuda and has historically been an important relationship within the group. Products and services can include quota-share and excess-of-loss arrangements, depending on contractual structure, insurance line, and risk-sharing requirements. The practical cost of these services is represented mainly by reinsurance premiums paid by cedants, while Maiden’s major economic costs include claims and claim-adjustment expenses, acquisition costs, commissions, general and administrative expenses, financing costs, and investment-related losses or gains.
Unlike a manufacturing or technology company, Maiden does not have a conventional bill of materials. Its equivalent production inputs are underwriting expertise, actuarial models, historical loss data, reinsurance capital, regulatory licenses, broker and cedant relationships, claims-management capabilities, and investment assets supporting policyholder obligations. Profitability depends on underwriting margins, reserve adequacy, premium volume, investment income, capital efficiency, and the timing and severity of claims. Reinsurance accounting can also create substantial volatility because reserve revisions, adverse development, commutations, and recoverability assessments may materially affect reported earnings and equity.
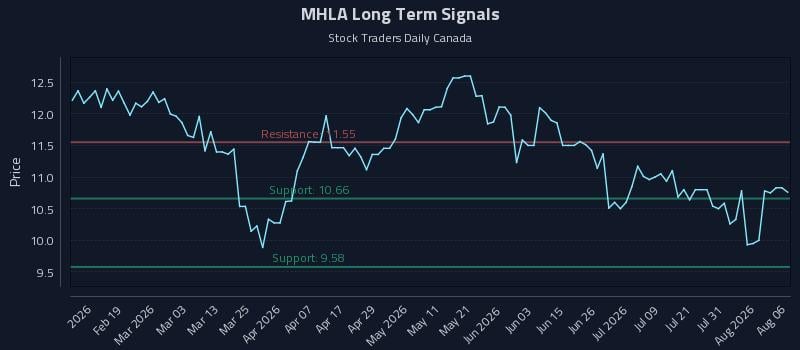
MHLA specifically identifies Maiden Holdings’ 6.625% notes due 2046. The notes were issued with an aggregate principal amount reported by the SEC at approximately $110 million, bear interest at 6.625% per year, and mature on June 14, 2046. Consequently, holders of MHLA generally have a creditor claim under the note terms rather than an ownership claim equivalent to common shareholders. The quoted price, dividend-like distribution, yield, and market capitalization figures shown in market databases may reflect debt-security conventions and should not automatically be interpreted as ordinary-stock valuation metrics. The supplied market data reports a price of approximately $10.625, a stated last distribution of about $1.65624, and a market capitalization near $920.3 million, but these figures may be database-specific or inconsistent with the legal structure of a debt issue.
The supplied trailing metrics indicate financial pressure, including a reported net loss, negative free cash flow, negative return on equity, and high financial leverage. Such indicators should be interpreted cautiously for an insurer because statutory capital, reserves, reinsurance recoverables, investment portfolios, and holding-company liquidity can be more informative than standard industrial-company ratios. Maiden’s reported workforce of 42 reflects a relatively lean corporate structure, with significant reliance on specialized personnel, external service providers, brokers, reinsurers, and affiliated relationships. Key leadership information supplied for this profile identifies Patrick Joseph Haveron as chief executive officer. Investors evaluating MHLA should review the latest SEC filings, note indenture, interest-payment terms, seniority, covenants, redemption provisions, issuer liquidity, regulatory capital, reserve development, and any restructuring or commutation activity before making conclusions about credit quality or investment value.
YoYYoY means Year-over-Year. It compares the latest annual value with the previous annual value to show long-term trend strength.
QoQQoQ means Quarter-over-Quarter. It compares the latest quarter with the immediately previous quarter to show short-term momentum changes.
RevenueThe total money that came through the front door from selling things, before paying a single bill. Think of it as the grand total of every credit card swipe from customers. (YoY compares this year to last year's performance, while QoQ compares the current three months to the previous three).
$56.4M
-36.8%
+289.0%
Net IncomeThe absolute bottom line. If the company paid every single supplier, employee, banker, and tax collector, this is the actual money left in their pocket at the end of the day.
$-201.0M
-421.1%
+94.5%
Gross MarginThe basic markup. If they sell a $100 pair of sneakers, this percentage tells you how much of that price tag is profit right after paying for the rubber and shoelaces, but before paying for things like store rent or TV commercials.
+100.0%
0.0%
0.0%
Operating MarginThe 'day job' efficiency score. Out of every dollar a customer spends, this shows how many cents the company keeps after making the product AND paying for all the everyday corporate overhead (like salaries, marketing, and keeping the lights on).
+37.4%
-42.9%
-89.7%
Net MarginThe final take-home percentage. When you strip away every conceivable cost, tax, and interest payment, this is the exact number of cents the company truly gets to keep from every dollar in sales.
-356.1%
-723.9%
-102.9%
Free Cash FlowThe holy grail of corporate cash. It's the spendable, physical money left over after the business pays for its daily operations AND buys the big, expensive upgrades (like new factories or servers) it needs to survive. This is the 'free' money they can use to pay dividends or buy back stock.
$-67.4M
-12.8%
+80.8%
FCF MarginThe ultimate cash conversion rate. It shows how good the company is at turning regular sales directly into cold, hard, spendable cash. A high percentage means the business is an absolute cash-printing machine.
-119.5%
-78.4%
-110.2%
Debt / EquityThe financial risk gauge. It compares how much of the company's empire was built using borrowed money (loans) versus the owners' own money (shareholders). A high number means they are heavily leveraged and playing a riskier game; a low number means they are playing it safe.
563.7%
+451.7%
+20.3%
Current RatioThe 12-month survival check. It simply compares the cash they have right now (plus things they can quickly turn into cash) against the immediate bills they absolutely must pay this year. A score above 1 means they have enough in the wallet to cover the upcoming bills without panicking.
—
—
—
Total AssetsThe absolute size of the company's empire. It bundles together absolutely everything of value they own—from the cash in the register and the inventory in the warehouse, to the software patents in the vault and the factories on the ground.