Zacks Investment Research8/11/2026Neutral
3 AgTech & Food Innovation Stocks to Buy as the Industry Evolves
AgTech and food innovation reshape agriculture and nutrition, putting ADM, DAR and BG firmly in focus.
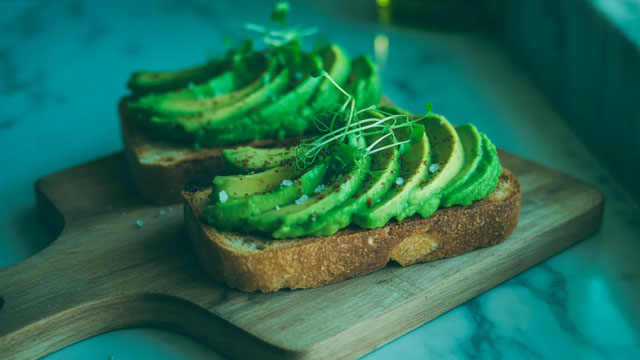
Ingredion Incorporated, along with its affiliated entities, specializes in the global production and sale of starches and sweeteners, catering to a diverse ...
Plutux is not an investment adviser. Market data and AI-generated analysis are for information and education only, not investment advice. Disclaimer
Est. EPS $2.63 · Revenue $1.80B · 3 analysts
Est. EPS $2.74 · Revenue $1.76B · 3 analysts
Est. EPS $10.53 · Revenue $7.20B · 5 analysts
Est. EPS $2.73 · Revenue $1.82B · 1 analysts
$3.28 per share
$3.28 per share
| Metric | Latest | YoYYoY means Year-over-Year. It compares the latest annual value with the previous annual value to show long-term trend strength. | QoQQoQ means Quarter-over-Quarter. It compares the latest quarter with the immediately previous quarter to show short-term momentum changes. |
|---|---|---|---|
| RevenueThe total money that came through the front door from selling things, before paying a single bill. Think of it as the grand total of every credit card swipe from customers. (YoY compares this year to last year's performance, while QoQ compares the current three months to the previous three). | $7.2B | -2.8% | +3.2% |
| Net IncomeThe absolute bottom line. If the company paid every single supplier, employee, banker, and tax collector, this is the actual money left in their pocket at the end of the day. | $729.0M | +12.7% | -19.7% |
| Gross MarginThe basic markup. If they sell a $100 pair of sneakers, this percentage tells you how much of that price tag is profit right after paying for the rubber and shoelaces, but before paying for things like store rent or TV commercials. | +25.3% | +5.0% | +2.9% |
| Operating MarginThe 'day job' efficiency score. Out of every dollar a customer spends, this shows how many cents the company keeps after making the product AND paying for all the everyday corporate overhead (like salaries, marketing, and keeping the lights on). | +14.4% | +20.9% | -9.4% |
| Net MarginThe final take-home percentage. When you strip away every conceivable cost, tax, and interest payment, this is the exact number of cents the company truly gets to keep from every dollar in sales. | +10.1% | +16.0% | -22.2% |
| Free Cash FlowThe holy grail of corporate cash. It's the spendable, physical money left over after the business pays for its daily operations AND buys the big, expensive upgrades (like new factories or servers) it needs to survive. This is the 'free' money they can use to pay dividends or buy back stock. | $511.0M | -55.0% | +87.0% |
| FCF MarginThe ultimate cash conversion rate. It shows how good the company is at turning regular sales directly into cold, hard, spendable cash. A high percentage means the business is an absolute cash-printing machine. | +7.1% | -53.7% | +87.4% |
| Debt / EquityThe financial risk gauge. It compares how much of the company's empire was built using borrowed money (loans) versus the owners' own money (shareholders). A high number means they are heavily leveraged and playing a riskier game; a low number means they are playing it safe. | 41.3% | -21.7% | -4.5% |
| Current RatioThe 12-month survival check. It simply compares the cash they have right now (plus things they can quickly turn into cash) against the immediate bills they absolutely must pay this year. A score above 1 means they have enough in the wallet to cover the upcoming bills without panicking. | 2.66x | +1.7% | +1.4% |
| Total AssetsThe absolute size of the company's empire. It bundles together absolutely everything of value they own—from the cash in the register and the inventory in the warehouse, to the software patents in the vault and the factories on the ground. | $7.9B | +6.1% | +1.8% |
| Metric | Annual (A vs E) | Annual Surprise | Quarter (A vs E) | Quarter Surprise |
|---|---|---|---|---|
| EPS Surprise | 11.18 vs 11.20 | -0.1% | 1.78 vs 2.63 | -32.4% |
| Revenue Surprise | $7.2B vs $7.2B | -0.4% | $1.9B vs $1.8B | +2.5% |
| Date | Executive | Title | Security | Side | Shares | Price |
|---|---|---|---|---|---|---|
| Aug 31, 2026 | Seip David Eric | officer: SVP, Global Ops and CSCO | Phantom Stock | A | 17 | — |
| Aug 31, 2026 | Leonard Michael J | officer: SVP, CIO & Head of Prot. Fort. | Phantom Stock | A | 33 | — |
| Aug 14, 2026 | Seip David Eric | officer: SVP, Global Ops and CSCO | Phantom Stock | A | 17 | — |
| Aug 14, 2026 | Leonard Michael J | officer: SVP, CIO & Head of Prot. Fort. | Phantom Stock | A | 32 | — |
| Aug 5, 2026 | Fischer David B | director | Common Stock | D | 1,662 | $102.31 |
Operator: Good day, and thank you for standing by. Welcome to Ingredion's Second Quarter 2026 Earnings Call. [Operator Instructions]. Please be advised that today's conference is being recorded. I'd now like to hand the conference over to Noah Weiss, Vice President of Investor Relations. Please go ahead. Noah Weiss: Good morning, and welcome to Ingredion's Second Quarter 2026 Earnings Call. I'm Noah Weiss, Vice President of Investor Relations. Joining me on today's call are Jim Zallie, our Chairman, President and CEO; and Jason Payant, our Vice President and Interim CFO. The press release issued this morning, along with the presentation we will reference during today's call, is available on ingredion.com in the Investors section. As a reminder, our comments within this presentation may contain forward-looking statements. These statements are subject to various risks and uncertainties and include expectations and assumptions regarding the company's future operations and financial performance. Actual results could differ materially from those estimated in the forward-looking statements, and Ingredion assumes no obligation to update them in the future as or if circumstances change. Additional information concerning factors that could cause actual results to differ materially from those discussed during today's conference call or in this morning's press release can be found in the company's most recently filed annual report on Form 10-K and subsequent reports on Forms 10-Q and 8-K. During the call, we also refer to certain non-GAAP financial measures, including adjusted earnings per share, adjusted operating income and adjusted effective tax rate, which are reconciled to U.S. GAAP measures in Note 2, non-GAAP information included in our press release and in today's presentation appendix. As part of our prepared remarks, we will touch on the announced acquisition of Tate & Lyle and the progress we have made since announcing the transaction. That said, given where we are in the process, we are limited in what we can disclose and cannot speculate on potential outcomes, timing, integration matters or other transaction-related topics beyond information already in the public domain. We appreciate your understanding and ask that questions today be focused on our operating results and outlook. With that, I will turn the call over to Jim. James Zallie: Thank you, Noah, and good morning, everyone. Ingredion delivered a second quarter performance, which was in line with expectations, led by continued momentum in Texture & Healthful Solutions, with net sales increasing 1% to $1.85 billion. Adjusted operating income was $258 million, down 5% from the prior year. Results were impacted by softer production and demand in our Food & Industrial Ingredients U.S./Canada segment and continued macroeconomic pressures in Mexico. At the same time, performance across the rest of the portfolio was strong as we delivered the second highest quarterly operating income ever in …
| Name | Title | Compensation | Gender | Year Born | Status |
|---|---|---|---|---|---|
James Zallie | Chairman, President & CEO | USD 3,757,664 | Male | 1961 | Active |
Rob Ritchie | Executive Vice President of Food & Industrial Ingredients of LATAM, US/Canada and Sugar Reduction | USD 1,204,913 | Male | 1970 | Active |
Eric Seip | Senior Vice President of Global Operations & Chief Supply Chain Officer | USD 1,161,019 | Male | 1968 | Active |
Nancy Wolfe | Senior Vice President & Chief Human Resources Officer | USD 1,139,570 | Female | 1970 | Active |
Tanya Jaeger de Foras | Senior Vice President, Chief Legal Officer, Corporate Secretary & Chief Compliance Officer | USD 1,128,808 | Female | 1971 | Active |
Robert O. Border | Vice President and Chief Digital & Information Officer | — | Male | 1964 | Active |
Valdirene Evans | Senior Vice President & President of Global Texture Solutions | — | Female | 1969 | Active |
Jason Payant | Interim CFO and VP of Finance, Global Texture & Healthful Solutions | — | Male | 1971 | Active |
Larry Fernandes | Senior Vice President and Chief Commercial & Sustainability Officer | — | Male | 1965 | Active |
Mark A. Karns | Vice President of Corporate Development and M&A | — | Male | 1980 | Active |
AgTech and food innovation reshape agriculture and nutrition, putting ADM, DAR and BG firmly in focus.
Ingredion beats Q2 estimates as 7% Texture & Healthful Solutions volume growth and FX gains offset Argo issues and higher costs.

Amundi grew its holdings in shares of Ingredion Incorporated (NYSE: INGR) by 19.4% in the first quarter, according to the company in its most recent 13F filing with the Securities and Exchange Commission. The fund owned 142,282 shares of the company's stock after acquiring an additional 23,122 shares during the quarter. Amundi owned
California State Teachers Retirement System raised its position in Ingredion Incorporated (NYSE: INGR) by 27.0% during the undefined quarter, according to its most recent filing with the Securities and Exchange Commission (SEC). The fund owned 76,804 shares of the company's stock after purchasing an additional 16,333 shares during the quarter. California State Teachers
Ingredion (NYSE: INGR) reported second-quarter 2026 results that were in line with its expectations, as continued growth in Texture and Healthful Solutions offset operational and macroeconomic pressures in other parts of the portfolio. Second-quarter net sales increased 1% year over year to $1.85 billion. Reported operating income was $188 million, while adjusted operating income declined 5%