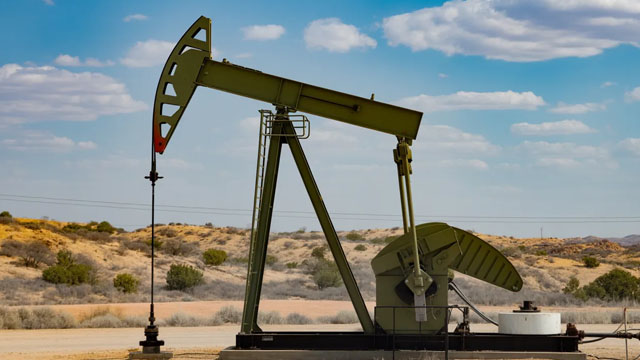
Halliburton Company is a multinational corporation and one of the world's largest oilfield service companies, with operations in over 70 countries. Founded in 1919 by Erle P. Halliburton, the company has evolved from pioneering oil-well cementing to offering a comprehensive suite of services and technologies for the energy sector. The ...Halliburton Company is a multinational corporation and one of the world's largest oilfield service companies, with operations in over 70 countries. Founded in 1919 by Erle P. Halliburton, the company has evolved from pioneering oil-well cementing to offering a comprehensive suite of services and technologies for the energy sector. The company's operations are structured into two primary divisions: Completion and Production (C&P) and Drilling and Evaluation (D&E). The C&P segment focuses on enhancing well productivity through stimulation, sand control, cementing, and a range of downhole completion tools, as well as production support services like coiled tubing and artificial lift. The D&E segment provides drilling fluids, drilling systems, wireline, perforating, drill bits, and digital technologies that leverage AI and cloud-based services for reservoir insights. Halliburton also offers project management and integrated asset management. With approximately 46,000 employees, the company generates significant revenue, and as of the latest TTM data, it has a market cap of about $26.6 billion. Financially, Halliburton shows a gross profit margin of 15.1%, an operating margin of 11.4%, and a net profit margin of 7.2%. Its return on equity is 15.1%, and it maintains a debt-to-equity ratio of 74.5%. The company invests in R&D (1.8% of revenue) and has a dividend yield of 2.1%. Under the leadership of CEO Jeffrey Miller, Halliburton continues to focus on innovation, efficiency, and sustainability to meet the evolving needs of the global energy industry.
YoYYoY means Year-over-Year. It compares the latest annual value with the previous annual value to show long-term trend strength.
QoQQoQ means Quarter-over-Quarter. It compares the latest quarter with the immediately previous quarter to show short-term momentum changes.
RevenueThe total money that came through the front door from selling things, before paying a single bill. Think of it as the grand total of every credit card swipe from customers. (YoY compares this year to last year's performance, while QoQ compares the current three months to the previous three).
$22.2B
-3.3%
+5.8%
Net IncomeThe absolute bottom line. If the company paid every single supplier, employee, banker, and tax collector, this is the actual money left in their pocket at the end of the day.
$1.3B
-48.7%
+15.8%
Gross MarginThe basic markup. If they sell a $100 pair of sneakers, this percentage tells you how much of that price tag is profit right after paying for the rubber and shoelaces, but before paying for things like store rent or TV commercials.
+15.7%
-16.2%
-3.8%
Operating MarginThe 'day job' efficiency score. Out of every dollar a customer spends, this shows how many cents the company keeps after making the product AND paying for all the everyday corporate overhead (like salaries, marketing, and keeping the lights on).
+10.2%
-38.8%
+8.3%
Net MarginThe final take-home percentage. When you strip away every conceivable cost, tax, and interest payment, this is the exact number of cents the company truly gets to keep from every dollar in sales.
+5.8%
-46.9%
+9.5%
Free Cash FlowThe holy grail of corporate cash. It's the spendable, physical money left over after the business pays for its daily operations AND buys the big, expensive upgrades (like new factories or servers) it needs to survive. This is the 'free' money they can use to pay dividends or buy back stock.
$1.7B
-31.0%
+627.2%
FCF MarginThe ultimate cash conversion rate. It shows how good the company is at turning regular sales directly into cold, hard, spendable cash. A high percentage means the business is an absolute cash-printing machine.
+7.5%
-28.6%
+587.5%
Debt / EquityThe financial risk gauge. It compares how much of the company's empire was built using borrowed money (loans) versus the owners' own money (shareholders). A high number means they are heavily leveraged and playing a riskier game; a low number means they are playing it safe.
77.7%
-6.9%
-0.2%
Current RatioThe 12-month survival check. It simply compares the cash they have right now (plus things they can quickly turn into cash) against the immediate bills they absolutely must pay this year. A score above 1 means they have enough in the wallet to cover the upcoming bills without panicking.
2.04x
-0.3%
-3.1%
Total AssetsThe absolute size of the company's empire. It bundles together absolutely everything of value they own—from the cash in the register and the inventory in the warehouse, to the software patents in the vault and the factories on the ground.
Operator: Good day, ladies and gentlemen. And thank you for standing by. Welcome to the second quarter 2020 Halliburton Company Earnings Conference Call. At this time, all participants are in a listen only mode. After the speakers' presentation, there will be a question and answer session. To ask a question at this time, you would need to press *11 on your telephone keypad. As a reminder, this conference call is being recorded. At this time, I would like to turn the conference over to Mr. David Coleman, Senior Director, Investor Relations. Sir, please begin.
David Coleman: Hello, and thank you for joining the Halliburton Second Quarter 2026 Conference Call. We will make the recording of today's webcast available for 7 days on Halliburton's website after this call. Joining me today are Jeffrey Allen Miller, Chairman, President and CEO, Shannon Slocum, executive vice president and COO, and Eric J. Carre, executive vice president and CFO. Today's comments may include forward looking statements that reflect Halliburton's views about future events. These matters involve risks and uncertainties that could cause our actual results to differ materially from our forward looking statements. These risks are discussed in Halliburton's Form 10-Ks for the year ended 12/31/2025, Form 10-Q for the quarter ended 03/31/2026, and current reports on Form 8-K, and other Securities and Exchange Commission filings. We undertake no obligation to revise or update publicly any forward looking statements for any reason, except as required by law. Our comments today also include non GAAP financial measures. Additional details and reconciliation to the most directly comparable GAAP financial measures are included in our second quarter earnings release and in the Quarterly Results and Presentation of our website. Now I will turn the call over to Jeffrey.
Jeffrey Allen Miller: Thank you, David, and good morning, everyone. I am pleased with Halliburton's second quarter performance. Our international business delivered its highest second quarter revenue in more than a decade, despite the disruption in The Middle East. Our North America business delivered sequential improvement and my outlook for our business is positive. Here are a few highlights from the second quarter. We delivered total company revenue of $5.7 billion and adjusted operating margin of 12%. International revenue was $3.4 billion an increase of 6% year over year. North America revenue was $2.3 billion flat year over year. During the second quarter, we generated $824 million of cash flow from operations, $668 million of free cash flow, and repurchased approximately $200 million of our common stock. Now let's turn to our macro outlook. On our last call, I shared my belief that the situation in The Middle East would have and long lasting implications for the global energy sector. What is ever more clear to me is how important energy is to a functioning global economy. The events we have seen since then only …