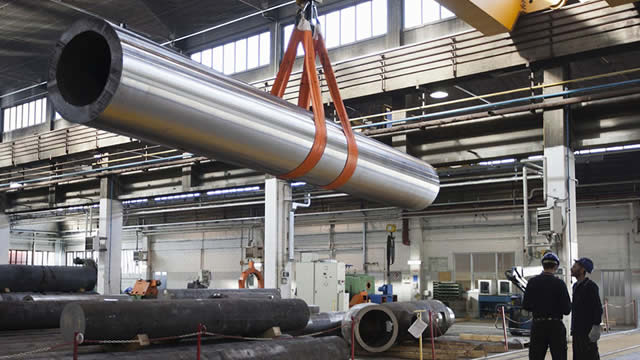
Ferroglobe PLC (NASDAQ: GSM) is a global advanced metallurgical products company focused on producing and supplying silicon metal and specialty alloys—particularly silicon and manganese-based ferroalloys—that are used as critical inputs in industrial manufacturing. The company’s core offering includes silicon metal and a suite of ferroalloy products such as silicomanganese and ...Ferroglobe PLC (NASDAQ: GSM) is a global advanced metallurgical products company focused on producing and supplying silicon metal and specialty alloys—particularly silicon and manganese-based ferroalloys—that are used as critical inputs in industrial manufacturing. The company’s core offering includes silicon metal and a suite of ferroalloy products such as silicomanganese and ferromanganese (commonly used as deoxidizing, desulphurizing, and degassing agents in steelmaking), ferrosilicon (used to make stainless and carbon steels and other alloys, and also for electrode and aluminum-related applications), and calcium silicon products supporting deoxidation and desulfurization steps in liquid steel processing. It also supplies foundry-related consumables such as nodularizers and inoculants for iron production, along with silica fume, an industrial by-product from its silicon metal and ferrosilicon production processes.
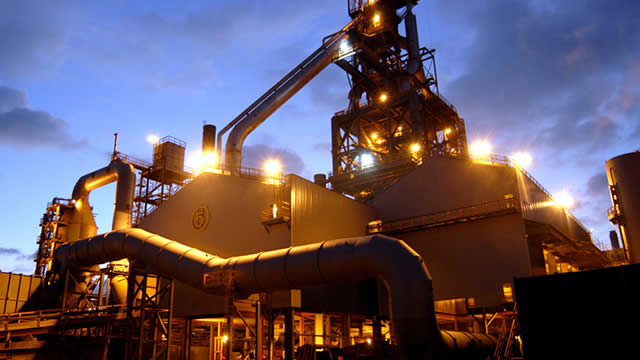
From a business perspective, Ferroglobe operates across the supply chain of metallurgical inputs: it runs industrial manufacturing of metallurgical products and maintains upstream resources and power/energy capabilities, including quartz mining and other raw material sourcing (e.g., coal, manganese ore, petroleum and metallurgical coke, electrodes, and additive metals), as well as hydroelectric power in France. This integrated approach can help support raw-material availability for producing silicon and ferroalloys and can reduce exposure to single-point supply disruptions.
On the cost/BOM side, the principal drivers typically include energy (electric power/thermal energy), key raw materials (quartz/silica and carbonaceous inputs such as coal/coke, plus manganese inputs where applicable), electrode consumables, and conversion losses typical of high-temperature metallurgical production. Inventory and working-capital management also matter in commodities-linked manufacturing; the provided TTM indicators show a measurable cash-conversion cycle, alongside current liquidity (current ratio around 1.29), which are important for managing feedstock procurement and production lead times.
Financially, the provided TTM profitability margins are negative (e.g., negative net and operating margins) and free cash flow metrics appear weak/negative, consistent with the volatility that can occur in metal/energy-intensive industries due to pricing cycles, energy costs, maintenance schedules, and demand fluctuations. Nevertheless, the company’s scale and product breadth position it as a “merchant producer” in silicon metal and a leading global supplier of related alloys.
Key people include Marco Levi, Chief Executive Officer, who has been publicly appointed to lead the company. Ferroglobe was incorporated in the United Kingdom in 2015 (originally under the name VeloNewco Limited) and was formed through the merger of Grupo FerroAtlántica and Globe Specialty Metals, creating a platform spanning both product expertise and global manufacturing footprint.
YoYYoY means Year-over-Year. It compares the latest annual value with the previous annual value to show long-term trend strength.
QoQQoQ means Quarter-over-Quarter. It compares the latest quarter with the immediately previous quarter to show short-term momentum changes.
RevenueThe total money that came through the front door from selling things, before paying a single bill. Think of it as the grand total of every credit card swipe from customers. (YoY compares this year to last year's performance, while QoQ compares the current three months to the previous three).
$1.3B
-18.8%
+8.9%
Net IncomeThe absolute bottom line. If the company paid every single supplier, employee, banker, and tax collector, this is the actual money left in their pocket at the end of the day.
$-170.7M
-825.2%
+956.0%
Gross MarginThe basic markup. If they sell a $100 pair of sneakers, this percentage tells you how much of that price tag is profit right after paying for the rubber and shoelaces, but before paying for things like store rent or TV commercials.
+3.4%
-89.5%
+111.0%
Operating MarginThe 'day job' efficiency score. Out of every dollar a customer spends, this shows how many cents the company keeps after making the product AND paying for all the everyday corporate overhead (like salaries, marketing, and keeping the lights on).
-14.9%
-741.1%
+285.5%
Net MarginThe final take-home percentage. When you strip away every conceivable cost, tax, and interest payment, this is the exact number of cents the company truly gets to keep from every dollar in sales.
-12.8%
-993.0%
+886.2%
Free Cash FlowThe holy grail of corporate cash. It's the spendable, physical money left over after the business pays for its daily operations AND buys the big, expensive upgrades (like new factories or servers) it needs to survive. This is the 'free' money they can use to pay dividends or buy back stock.
$-19.2M
-111.5%
+205.0%
FCF MarginThe ultimate cash conversion rate. It shows how good the company is at turning regular sales directly into cold, hard, spendable cash. A high percentage means the business is an absolute cash-printing machine.
-1.4%
-114.2%
+196.4%
Debt / EquityThe financial risk gauge. It compares how much of the company's empire was built using borrowed money (loans) versus the owners' own money (shareholders). A high number means they are heavily leveraged and playing a riskier game; a low number means they are playing it safe.
42.3%
+53.5%
-12.9%
Current RatioThe 12-month survival check. It simply compares the cash they have right now (plus things they can quickly turn into cash) against the immediate bills they absolutely must pay this year. A score above 1 means they have enough in the wallet to cover the upcoming bills without panicking.
1.66x
-8.8%
-9.9%
Total AssetsThe absolute size of the company's empire. It bundles together absolutely everything of value they own—from the cash in the register and the inventory in the warehouse, to the software patents in the vault and the factories on the ground.
Operator: Good morning, ladies and gentlemen, and welcome to Ferroglobe's Second Quarter 2026 Earnings Call. [Operator Instructions]. As a reminder, this conference call may be recorded. I would now like to turn the call over to Alex Rotonen, Ferroglobe's Vice President of Investor Relations. You may begin.
Alex Rotonen: Good morning, everyone, and thank you for joining Ferroglobe's Second Quarter 2026 Conference Call. Joining me today are Marco Levi, our Chief Executive Officer; and Beatriz Garcia-Cos, our Chief Financial Officer. Before we get started with some prepared remarks, I'm going to read a brief statement. Please turn to Slide 2 at this time. Statements made by management during this conference call that are forward-looking are based on current expectations. Factors that could cause actual results to differ materially from these forward-looking statements can be found in Ferroglobe's most recent SEC filings and the exhibits to those filings, which are available at ferroglobe.com. In addition, this discussion includes references to EBITDA, adjusted EBITDA, adjusted gross debt, adjusted net debt and adjusted diluted earnings per share, among other non-IFRS measures. Reconciliation of non-IFRS measures may be found in our most recent SEC filings. We'll be participating in the Seaport Annual Summer Conference on August 18 and 19 and the IDEAS Conference in Chicago on August 26. We hope to see you there. With that, I'll turn the call over to Marco.
Marco Levi: Thank you, Alex, and thank you all for joining us today. We appreciate your continued interest in Ferroglobe. Our second quarter results reflect solid execution despite a challenging market environment. Our total shipments increased 7% quarter-over-quarter to 188,000 tons, mainly due to a 34% increase in silicon metal. This resulted in a 9% increase in quarterly revenue to $379 million. Our adjusted EBITDA increased $10 million to $13 million and free cash flow improved by $37 million to $20 million. Beatriz will provide more detailed comments in her section. Next slide, please. Now I would like to turn your attention to how we see Ferroglobe evolving and how we strive to create value for shareholders. As we look at Ferroglobe today, there are 4 key areas that we believe will drive shareholder value going forward. First, growing our critical materials platform; second, lowering the overall cost structure by optimizing our industrial footprint and implementing cost-cutting measures. Third, planning a restart of low-cost operations in Venezuela with advantaged access to the U.S. market; and fourth, strengthening the core business through trade protection while leveraging the onshoring and supply chain realignment taking place across the U.S. and Europe. Few Western companies possess the combination of furnace infrastructure, metallurgical expertise, vertically integrated raw material sourcing and strong customer relationships that Ferroglobe has built over many years. We believe those …