The Motley Fool8/10/2026Neutral
Why Garmin Stock Soared in July and Is at an All-Time High
Fitness is Garmin's largest and fastest growing segment. Garmin's valuation needs to take its cash its stellar balance sheet into account.
Garmin Ltd. specializes in the design, development, manufacturing, marketing, and global distribution of diverse wireless products and solutions. Its operations span across ...
Plutux is not an investment adviser. Market data and AI-generated analysis are for information and education only, not investment advice. Disclaimer
$4.20 per share
Est. EPS $2.39 · Revenue $1.99B · 5 analysts
Est. EPS $10.15 · Revenue $8.11B · 5 analysts
$4.20 per share
| Metric | Latest | YoYYoY means Year-over-Year. It compares the latest annual value with the previous annual value to show long-term trend strength. | QoQQoQ means Quarter-over-Quarter. It compares the latest quarter with the immediately previous quarter to show short-term momentum changes. |
|---|---|---|---|
| RevenueThe total money that came through the front door from selling things, before paying a single bill. Think of it as the grand total of every credit card swipe from customers. (YoY compares this year to last year's performance, while QoQ compares the current three months to the previous three). | $7.2B | +15.1% | +15.3% |
| Net IncomeThe absolute bottom line. If the company paid every single supplier, employee, banker, and tax collector, this is the actual money left in their pocket at the end of the day. | $1.7B | +17.9% | +33.8% |
| Gross MarginThe basic markup. If they sell a $100 pair of sneakers, this percentage tells you how much of that price tag is profit right after paying for the rubber and shoelaces, but before paying for things like store rent or TV commercials. | +58.7% | +0.1% | +5.0% |
| Operating MarginThe 'day job' efficiency score. Out of every dollar a customer spends, this shows how many cents the company keeps after making the product AND paying for all the everyday corporate overhead (like salaries, marketing, and keeping the lights on). | +25.9% | +2.3% | +23.6% |
| Net MarginThe final take-home percentage. When you strip away every conceivable cost, tax, and interest payment, this is the exact number of cents the company truly gets to keep from every dollar in sales. | +23.0% | +2.5% | +16.0% |
| Free Cash FlowThe holy grail of corporate cash. It's the spendable, physical money left over after the business pays for its daily operations AND buys the big, expensive upgrades (like new factories or servers) it needs to survive. This is the 'free' money they can use to pay dividends or buy back stock. | $1.4B | +10.0% | -55.2% |
| FCF MarginThe ultimate cash conversion rate. It shows how good the company is at turning regular sales directly into cold, hard, spendable cash. A high percentage means the business is an absolute cash-printing machine. | +18.8% | -4.4% | -61.2% |
| Debt / EquityThe financial risk gauge. It compares how much of the company's empire was built using borrowed money (loans) versus the owners' own money (shareholders). A high number means they are heavily leveraged and playing a riskier game; a low number means they are playing it safe. | 2.2% | +5.3% | +9.0% |
| Current RatioThe 12-month survival check. It simply compares the cash they have right now (plus things they can quickly turn into cash) against the immediate bills they absolutely must pay this year. A score above 1 means they have enough in the wallet to cover the upcoming bills without panicking. | 3.63x | +2.6% | -30.6% |
| Total AssetsThe absolute size of the company's empire. It bundles together absolutely everything of value they own—from the cash in the register and the inventory in the warehouse, to the software patents in the vault and the factories on the ground. | $11.0B | +14.2% | +4.3% |
| Metric | Annual (A vs E) | Annual Surprise | Quarter (A vs E) | Quarter Surprise |
|---|---|---|---|---|
| EPS Surprise | 8.59 vs 8.20 | +4.7% | 2.80 vs 2.39 | +17.2% |
| Revenue Surprise | $7.2B vs $7.1B | +1.4% | $2.0B vs $2.0B | +1.7% |
| Date | Executive | Title | Security | Side | Shares | Price |
|---|---|---|---|---|---|---|
| Aug 18, 2026 | Wang Cheng-Wei | officer: General Manager - Garmin Corp. | Registered Shares | D | 1,390 | $296.92 |
| Aug 18, 2026 | Wang Cheng-Wei | officer: General Manager - Garmin Corp. | Registered Shares | D | 3,102 | $297.84 |
| Aug 18, 2026 | Wang Cheng-Wei | officer: General Manager - Garmin Corp. | Registered Shares | D | 538 | $299.17 |
| Aug 18, 2026 | Wang Cheng-Wei | officer: General Manager - Garmin Corp. | Registered Shares | D | 1,737 | $300.14 |
| Aug 18, 2026 | Wang Cheng-Wei | officer: General Manager - Garmin Corp. | Registered Shares | D | 2,260 | $301.01 |
Operator: Hello, everyone. Thank you for joining us, and welcome to the Garmin Limited Second Quarter 26 Earnings Call. After today's prepared remarks, we will host a question-and-answer session. To withdraw your question, press 1 again. I will now hand the conference over to Teri Seck, Director of Investor Relations. Please go ahead. Teri Seck: Good morning. We would like to welcome you to Garmin Limited's second quarter 26 Earnings Call. Please note that the earnings press release and related slides are available at Garmin's Investor Relations site on the Internet at www.garmin.com/investors. An archive of the webcast and related transcript will also be available on our website. This earnings call includes projections and other forward-looking statements regarding Garmin Limited and its business. Any statements regarding our future financial position revenues, segment growth rates, earnings, gross margins, operating margins, future dividends or share repurchases, market shares, product introductions, foreign currency, tariff impacts, future demand for our products and plans and objectives are forward looking statements. The forward-looking events and circumstances discussed in this earnings call may not occur and actual results could differ materially as a result of risk factors affecting Garmin. Information concerning these risk factors is contained in our Form 10-K filed with the Securities and Exchange Commission. Presenting on behalf of Garmin Limited this morning are Cliff Pemble, president and chief executive officer and Douglas Gerard Boessen, chief financial officer and treasurer. At this time, I would like to turn the call over to Cliff Pemble. Clifton Albert Pemble: Thank you, Teri, and good morning, everyone. As announced earlier today, Garmin achieved another quarter of record breaking financial results in a continuation of the positive trends we have been experiencing over the long term. Consolidated revenue increased 11%, to $2.02 billion We experienced robust expansion in consolidated gross and operating margins, the majority of which is attributable to favorable product mix. Margins also benefited from a $21 million tariff refund recognized in the second quarter. Even when excluding this benefit, our gross margin performance was impressive by any historical comparison reflecting the strength of our product lines, our vertically integrated business model, exceptional execution by our global team. Operating income increased 30% to $616 million. And pro forma EPS increased 29% to $2.81. Our first half performance exceeded expectations and gives us confidence to raise our full-year 2026 guidance. We now expect 2026 revenue of approximately $8.05 billion pro forma EPS of $10 per share. Services have been an area of strategic focus in recent years with each business segment pursuing unique opportunities to grow service revenue over the long term. We recently announced the strategic acquisition of Training Peaks, and TrainHeroic, …
| Name | Title | Compensation | Gender | Year Born | Status |
|---|---|---|---|---|---|
Clifton Albert Pemble | President, Chief Executive Officer & Director | USD 1,444,269 | Male | 1966 | Active |
Philip I. Straub | Executive Vice President & MD of Aviation - Garmin International, Inc | USD 892,033 | Male | 1971 | Active |
Douglas Gerard Boessen | Chief Financial Officer & Treasurer | USD 844,846 | Male | 1963 | Active |
Bradley Trenkle | Co-Chief Operating Officer | USD 637,754 | Male | 1980 | Active |
Patrick G. Desbois | Co-Chief Operating Officer | USD 637,754 | Male | 1969 | Active |
Min-Hwan Kao | Co-Founder & Executive Chairman | USD 384,430 | — | 1949 | Active |
Teri Seck | Director of Investor Relations | — | Female | — | Active |
Joshua H. Maxfield | Vice President, General Counsel & Secretary | — | Male | 1973 | Active |
Ted Gartner | Director of Corporate Communications | — | Male | — | Active |
Laurie Minard | Vice President of Human Resources | — | Female | 1967 | Active |
Fitness is Garmin's largest and fastest growing segment. Garmin's valuation needs to take its cash its stellar balance sheet into account.
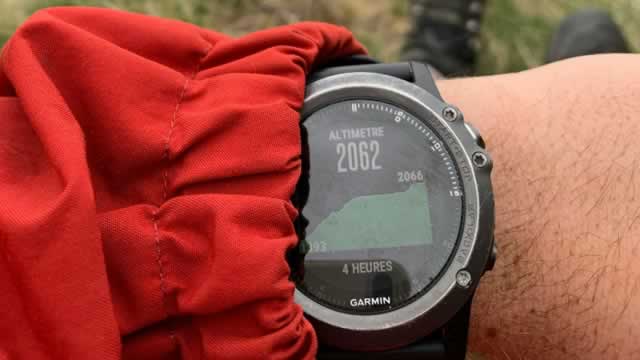
The Cirqa health tracker, Garmin's screenless health band, offers lots of data with no distractions.
On August 05, 2026, we conducted a DCF analysis for Garmin Ltd (GRMN), a company that has shown strong price performance recently, with a year-to-date increase
Garmin Ltd. (GRMN) rises 5,212% since first institutional outlier inflow signal.
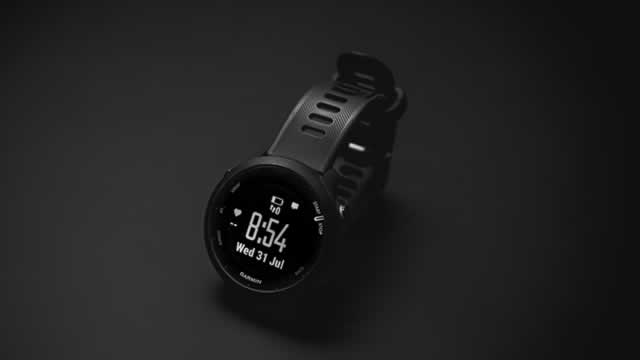
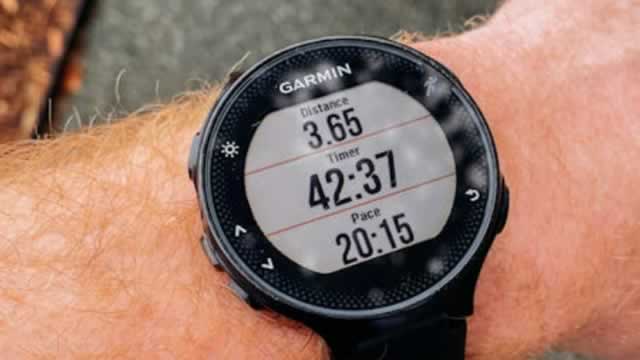
The Forerunner 70 is Garmin's new, entry-level smart fitness watch. At $250, it's Garmin's cheapest Forerunner device, but does it behave like one?