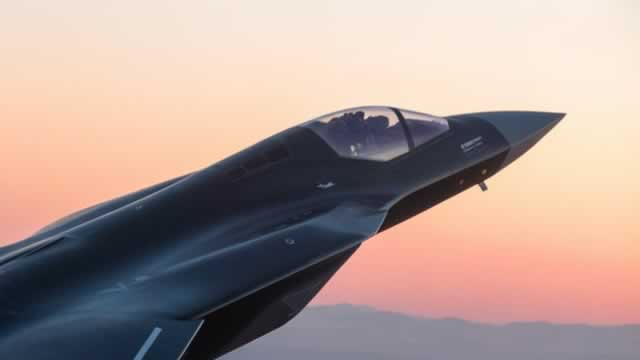
Established in Arlington, Virginia, in 1969, Leonardo DRS, Inc. is a leading supplier of advanced defense products and technologies. The company's diverse ...
Headquartered in Arlington, Virginia, Leonardo DRS, Inc. was founded in 1969 and has grown into a key provider of defense technology. The company's portfolio includes sophisticated sensing solutions like infrared systems for threat identification and situational awareness, uncooled infrared technologies, and brownout mitigation systems. Its electronic warfare capabilities span airborne, ...Headquartered in Arlington, Virginia, Leonardo DRS, Inc. was founded in 1969 and has grown into a key provider of defense technology. The company's portfolio includes sophisticated sensing solutions like infrared systems for threat identification and situational awareness, uncooled infrared technologies, and brownout mitigation systems. Its electronic warfare capabilities span airborne, vehicle-mounted, and soldier-borne systems, supported by specialized software and training. The company also develops robust computing systems for military platforms, including network and data distribution, integrated sensors, and resilient computing infrastructure. In force protection, DRS offers counter-unmanned aerial systems, short-range air defense, and active protection systems. Additionally, DRS provides power management and propulsion technologies, including hybrid electric drives, energy storage, gas turbine packages, nuclear instrumentation, and thermal management. Serving a broad client base including the U.S. military, major aerospace contractors, and intelligence agencies, DRS reported a revenue of $3.6 billion, with a market cap around $11.96 billion as of the latest data. The company operates with about 7,000 employees, emphasizing innovation and support for national security. Financially, DRS shows a gross profit margin of 24.4%, an operating margin of 10.5%, and a net margin of 8.5%, indicating solid profitability. With a current ratio of 1.9 and a debt-to-equity ratio of 0.05, the company maintains a healthy balance sheet. Its commitment to research and development, despite no R&D expense reported, is evident through its advanced product offerings. Key leaders include CEO John A. Baylouny (as per recent data) and former CEO William J. Lynn, who led the company from 2012. The company's vision is to protect those who defend, and it continues to innovate in defense technology.
YoYYoY means Year-over-Year. It compares the latest annual value with the previous annual value to show long-term trend strength.
QoQQoQ means Quarter-over-Quarter. It compares the latest quarter with the immediately previous quarter to show short-term momentum changes.
RevenueThe total money that came through the front door from selling things, before paying a single bill. Think of it as the grand total of every credit card swipe from customers. (YoY compares this year to last year's performance, while QoQ compares the current three months to the previous three).
$3.6B
+12.8%
+7.9%
Net IncomeThe absolute bottom line. If the company paid every single supplier, employee, banker, and tax collector, this is the actual money left in their pocket at the end of the day.
$278.0M
+30.5%
+38.7%
Gross MarginThe basic markup. If they sell a $100 pair of sneakers, this percentage tells you how much of that price tag is profit right after paying for the rubber and shoelaces, but before paying for things like store rent or TV commercials.
+23.8%
+4.7%
+3.4%
Operating MarginThe 'day job' efficiency score. Out of every dollar a customer spends, this shows how many cents the company keeps after making the product AND paying for all the everyday corporate overhead (like salaries, marketing, and keeping the lights on).
+9.5%
+5.3%
+22.7%
Net MarginThe final take-home percentage. When you strip away every conceivable cost, tax, and interest payment, this is the exact number of cents the company truly gets to keep from every dollar in sales.
+7.6%
+15.7%
+28.5%
Free Cash FlowThe holy grail of corporate cash. It's the spendable, physical money left over after the business pays for its daily operations AND buys the big, expensive upgrades (like new factories or servers) it needs to survive. This is the 'free' money they can use to pay dividends or buy back stock.
$227.0M
+22.0%
+106.3%
FCF MarginThe ultimate cash conversion rate. It shows how good the company is at turning regular sales directly into cold, hard, spendable cash. A high percentage means the business is an absolute cash-printing machine.
+6.2%
+8.2%
+105.8%
Debt / EquityThe financial risk gauge. It compares how much of the company's empire was built using borrowed money (loans) versus the owners' own money (shareholders). A high number means they are heavily leveraged and playing a riskier game; a low number means they are playing it safe.
17.2%
-3.9%
-2.6%
Current RatioThe 12-month survival check. It simply compares the cash they have right now (plus things they can quickly turn into cash) against the immediate bills they absolutely must pay this year. A score above 1 means they have enough in the wallet to cover the upcoming bills without panicking.
1.89x
-2.5%
+2.9%
Total AssetsThe absolute size of the company's empire. It bundles together absolutely everything of value they own—from the cash in the register and the inventory in the warehouse, to the software patents in the vault and the factories on the ground.
Operator: Ladies and gentlemen, good day, and welcome to the Leonardo DRS Second Quarter Fiscal Year 2026 Earnings Conference Call. At this time, all participants are in a listen-only mode. Following the company's prepared remarks, there will be an opportunity to ask questions. Instructions will be provided at that time. As a reminder, this event is being recorded. I would now like to turn the conference over to Stephen Vather, Senior Vice President, Corporate Development and Investor Relations. Please go ahead.
Stephen Vather: Good morning, and welcome, everyone. Thank you for joining today's quarterly earnings conference call. With me today are John A. Baylouny, our President and CEO and Michael Dippold, our CFO. They will discuss our strategy, operational highlights, financial results, and outlook. Today's call is being webcast on the Investor Relations section of the website. Where you can find the earnings release and supplemental presentation. Management may also make forward-looking statements during the call regarding future events, future trends and the anticipated future performance of the company. We caution you that such statements are not guarantees of future performance and involve risks and uncertainties that are difficult to predict. Actual results may differ materially from those projected in the forward-looking statements due to a variety of factors. These statements, including those relating to the pending acquisition of Raft LLC, including the expected timing of completion of the transaction, the satisfaction of closing conditions, the receipt of regulatory approvals, and the anticipated benefits of the transaction in plans for the integration of the acquired business. For a full discussion of the risk factors, please refer to our latest Form 10-K and our other SEC filings. We undertake no obligation other than as may be required by law to update any of the forward-looking statements made on this call. During the call, management will also discuss non-GAAP financial measures, which we believe provide useful information for investors. These non-GAAP measures should not be evaluated in isolation or as a substitute for GAAP performance measures. You can find a reconciliation of the non-GAAP measures discussed on this call in our earnings release. With that, I will turn the call over to John. John?
John A. Baylouny: Thank you, Steve, and good morning, everyone. We appreciate you joining us for a review of our second quarter 2026 results. Q2 was another strong quarter that builds directly on the foundation that we have laid over the past several years. Organic revenue growth accelerated to 10% year over year. Bookings exceeded $1 billion driving book-to-bill to 1.2x for the quarter. Demand was apparent throughout the portfolio and our Q2 book-to-bill extended our streak of 18 quarters with book-to-bill at or above 1.0. Furthermore, we exited the quarter with a record funded backlog given our conservative bookings and backlog …