
Zacks Investment ResearchyesterdayNeutral
Why Is Healthpeak (DOC) Down 3.5% Since Last Earnings Report?
Healthpeak (DOC) reported earnings 30 days ago. What's next for the stock?
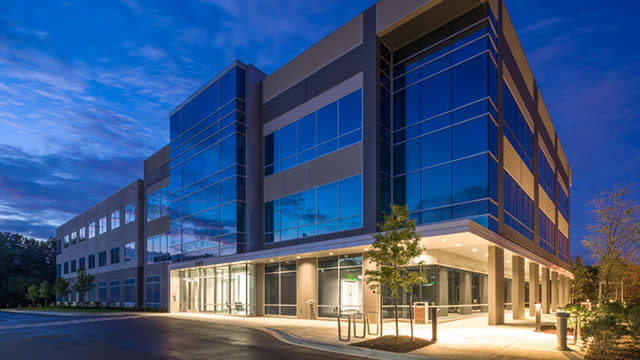
Healthpeak Properties, Inc. is an S&P 500 constituent operating as a fully integrated real estate investment trust (REIT). The firm is dedicated ...
Plutux is not an investment adviser. Market data and AI-generated analysis are for information and education only, not investment advice. Disclaimer
$1.22 per share
$1.22 per share
Est. EPS $0.06 · Revenue $738.04M · 5 analysts
Est. EPS $0.43
| Metric | Latest | YoYYoY means Year-over-Year. It compares the latest annual value with the previous annual value to show long-term trend strength. | QoQQoQ means Quarter-over-Quarter. It compares the latest quarter with the immediately previous quarter to show short-term momentum changes. |
|---|---|---|---|
| RevenueThe total money that came through the front door from selling things, before paying a single bill. Think of it as the grand total of every credit card swipe from customers. (YoY compares this year to last year's performance, while QoQ compares the current three months to the previous three). | $2.8B | +4.5% | +2.5% |
| Net IncomeThe absolute bottom line. If the company paid every single supplier, employee, banker, and tax collector, this is the actual money left in their pocket at the end of the day. | $71.3M | -70.7% | -67.3% |
| Gross MarginThe basic markup. If they sell a $100 pair of sneakers, this percentage tells you how much of that price tag is profit right after paying for the rubber and shoelaces, but before paying for things like store rent or TV commercials. | +22.5% | -62.7% | +384.5% |
| Operating MarginThe 'day job' efficiency score. Out of every dollar a customer spends, this shows how many cents the company keeps after making the product AND paying for all the everyday corporate overhead (like salaries, marketing, and keeping the lights on). | +19.3% | +10.5% | +4.1% |
| Net MarginThe final take-home percentage. When you strip away every conceivable cost, tax, and interest payment, this is the exact number of cents the company truly gets to keep from every dollar in sales. | +2.5% | -71.9% | -68.1% |
| Free Cash FlowThe holy grail of corporate cash. It's the spendable, physical money left over after the business pays for its daily operations AND buys the big, expensive upgrades (like new factories or servers) it needs to survive. This is the 'free' money they can use to pay dividends or buy back stock. | $1.3B | +17.0% | -320.5% |
| FCF MarginThe ultimate cash conversion rate. It shows how good the company is at turning regular sales directly into cold, hard, spendable cash. A high percentage means the business is an absolute cash-printing machine. | +44.4% | +11.9% | -315.2% |
| Debt / EquityThe financial risk gauge. It compares how much of the company's empire was built using borrowed money (loans) versus the owners' own money (shareholders). A high number means they are heavily leveraged and playing a riskier game; a low number means they are playing it safe. | 139.2% | +29.6% | -3.9% |
| Current RatioThe 12-month survival check. It simply compares the cash they have right now (plus things they can quickly turn into cash) against the immediate bills they absolutely must pay this year. A score above 1 means they have enough in the wallet to cover the upcoming bills without panicking. | 1.09x | -3.3% | +24.6% |
| Total AssetsThe absolute size of the company's empire. It bundles together absolutely everything of value they own—from the cash in the register and the inventory in the warehouse, to the software patents in the vault and the factories on the ground. | $20.3B | +2.0% | +0.3% |
| Metric | Annual (A vs E) | Annual Surprise | Quarter (A vs E) | Quarter Surprise |
|---|---|---|---|---|
| EPS Surprise | 0.10 vs 0.01 | +1200.4% | 0.08 vs 0.06 | +42.2% |
| Revenue Surprise | $2.8B vs $2.8B | +2.4% | $771.6M vs $738.0M | +4.5% |
| Date | Executive | Title | Security | Side | Shares | Price |
|---|---|---|---|---|---|---|
| May 29, 2026 | Thomas John T | director | Common Stock | A | 1,385 | $15.46 |
| May 29, 2026 | Thomas John T | director | Common Stock | D | 78 | $19.15 |
| May 29, 2026 | Patadia Ankit B. | officer: EVP and Treasurer | Common Stock | A | 1,358 | $15.46 |
| May 29, 2026 | Patadia Ankit B. | officer: EVP and Treasurer | Common Stock | D | 94 | $19.15 |
| May 29, 2026 | Moses Kelvin O | officer: Chief Financial Officer | Common Stock | A | 937 | $15.46 |
Operator: Good morning, and welcome to the Healthpeak Properties, Inc. Second Quarter 2026 Conference Call. Please note, this event is being recorded. I would now like to turn the conference over to Andrew Johns, Senior Vice President, Investor Relations. Please go ahead. Andrew Johns: Welcome. Today's conference call contains certain forward-looking statements. Although we believe the expectations reflected in any forward-looking statements are based on reasonable assumptions, these statements are subject to risks and uncertainties that may cause actual results to differ materially from our expectations. A discussion of risk and risk factors is included in our press release and detailed in our filings with the SEC. We do not undertake a duty to update any forward-looking statements. Certain non-GAAP measures will be discussed on this call. In an 8-K that we filed with SEC yesterday, we have reconciled all non-GAAP financial measures to the most directly comparable GAAP measures in accordance with regulatory requirements. The exhibit is also available on our website at healthpeak.com. I'll now turn the call over to our President and Chief Executive Officer, Scott Brinker. Scott Brinker: Thanks, A.J., and welcome to Healthpeak's second quarter earnings call. WE CARE is the acronym we use for our core values with the W representing our winning mindset. That's easy to do when demand exceeds supply and fundamentals are in your favor. Everyone's happy and looks really smart. It's a lot harder to do when supply exceeds demand, but that's exactly when a winning mindset is needed the most. As the life science pendulum finally starts to swing back in our favor, I want to say thank you to the team here who live up to our core values and maintain a winning mindset these past four years. It absolutely paid off, and we're stronger because of it. The downturn also provided a window to redefine our company and reset the competitive landscape. We were bold and strategic, including a $5 billion merger and $1 billion IPO. Today, we're a bigger and better company because of those decisive actions. Even more important, we added capabilities, including strategic new hires and internalizing property management in much of our renewal leasing. Now we're in the process of rolling out our agentic operating platform. This modern version of Healthpeak is an on-the-ground operator who generates superior results with our people and platform. We're already seeing a payoff from this strategy. In the past two quarters, two of the largest and most respected real estate investors in the world chose Healthpeak as their operating partner. Neither Blackstone or Brookfield had any meaningful prior exposure to the outpatient medical sector. Both joint ventures allow us to maintain control of strategic buildings and tenant relationships, while providing an alternative source of equity capital. We're excited to grow both of those partnerships in the future. Our balance sheet is …
| Name | Title | Compensation | Gender | Year Born | Status |
|---|---|---|---|---|---|
Scott Brinker | President, Chief Executive Officer & Director | USD 2,864,306 | Male | 1977 | Active |
Adam G. Mabry | Chief Investment Officer | USD 1,408,855 | Male | 1985 | Active |
Kelvin O. Moses | Chief Financial Officer | USD 1,374,652 | Male | 1989 | Active |
Scott R. Bohn | Chief Development Officer & Head of Lab | USD 1,265,897 | Male | 1980 | Active |
Tracy A. Porter | Executive Vice President, General Counsel & ESG | USD 998,011 | Female | 1978 | Active |
Michelle Wood | Senior VP, CFO and Controller of Senior Housing & Lab | — | Female | — | Active |
Andrew Johns | Senior Vice President of Investor Relations | — | Male | — | Active |
James A. Croy | Senior Vice President of Leasing - Outpatient Medical | — | Male | — | Active |
R. Justin Hill | Senior Vice President of Outpatient Medical | — | Male | — | Active |
Shawn G. Johnston | Executive Vice President & Chief Accounting Officer | — | Male | 1980 | Active |
Healthpeak (DOC) reported earnings 30 days ago. What's next for the stock?
SAN FRANCISCO, Sept. 01, 2026 (GLOBE NEWSWIRE) -- Healthpeak Properties, Inc. (NYSE: DOC) is a fully integrated real estate investment trust (REIT) and S&P 500 company.

Investors looking for stocks in the REIT and Equity Trust - Other sector might want to consider either Healthpeak (DOC) or EastGroup Properties (EGP). But which of these two stocks offers value investors a better bang for their buck right now?
Adelante Capital Management LLC purchased a new stake in Healthpeak Properties, Inc. (NYSE: DOC) in the undefined quarter, according to its most recent filing with the Securities and Exchange Commission. The fund purchased 1,009,623 shares of the real estate investment trust's stock, valued at approximately $21,605,000. Healthpeak Properties makes up 1.4% of Adelante

Advisors Capital Management LLC raised its holdings in shares of Healthpeak Properties, Inc. (NYSE: DOC) by 5.0% in the second quarter, according to its most recent 13F filing with the Securities and Exchange Commission. The institutional investor owned 1,576,297 shares of the real estate investment trust's stock after purchasing an additional 75,700 shares