
Fool - Investing News8/21/2026Neutral
Breakfast News: Week in Review
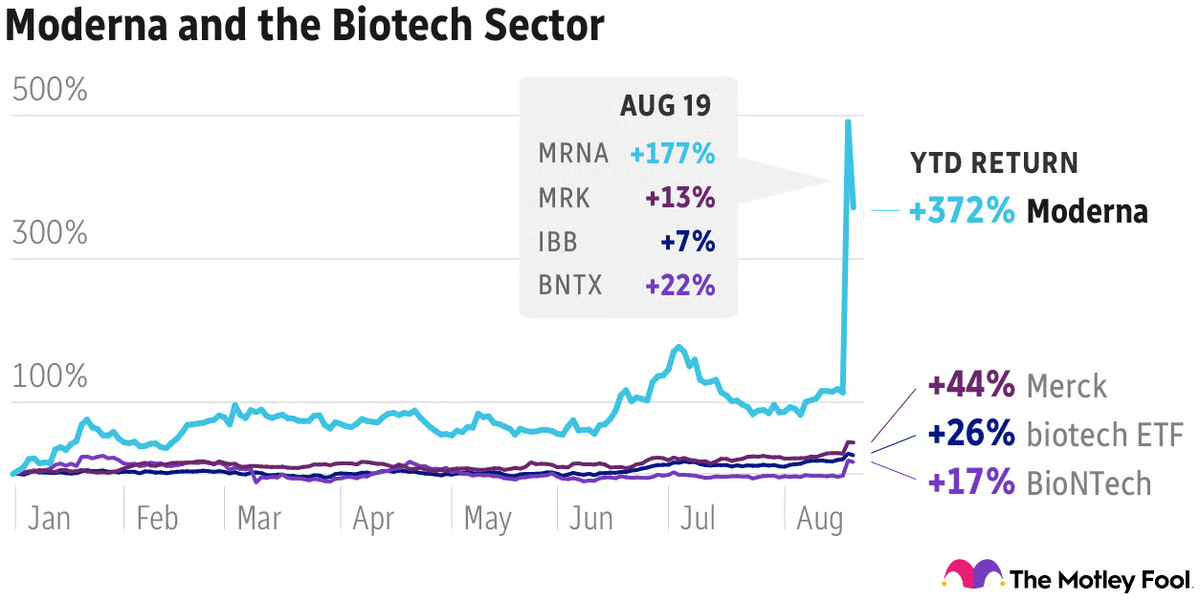
Moderna jumped 177% on a cancer-vaccine first, plus retail's reversal
DoorDash, Inc. operates a comprehensive logistics platform globally and within the United States, linking merchants, consumers, and delivery personnel ('dashers'). Through its ...
Plutux is not an investment adviser. Market data and AI-generated analysis are for information and education only, not investment advice. Disclaimer
Est. EPS $0.83 · Revenue $4.56B · 22 analysts
Est. EPS $0.84 · Revenue $4.79B · 21 analysts
Est. EPS $2.62 · Revenue $17.85B · 29 analysts
Est. EPS $0.85 · Revenue $4.94B · 15 analysts
| Metric | Latest | YoYYoY means Year-over-Year. It compares the latest annual value with the previous annual value to show long-term trend strength. | QoQQoQ means Quarter-over-Quarter. It compares the latest quarter with the immediately previous quarter to show short-term momentum changes. |
|---|---|---|---|
| RevenueThe total money that came through the front door from selling things, before paying a single bill. Think of it as the grand total of every credit card swipe from customers. (YoY compares this year to last year's performance, while QoQ compares the current three months to the previous three). | $13.7B | +27.9% | +10.4% |
| Net IncomeThe absolute bottom line. If the company paid every single supplier, employee, banker, and tax collector, this is the actual money left in their pocket at the end of the day. | $935.0M | +660.2% | +9.3% |
| Gross MarginThe basic markup. If they sell a $100 pair of sneakers, this percentage tells you how much of that price tag is profit right after paying for the rubber and shoelaces, but before paying for things like store rent or TV commercials. | +50.9% | +5.3% | +4.0% |
| Operating MarginThe 'day job' efficiency score. Out of every dollar a customer spends, this shows how many cents the company keeps after making the product AND paying for all the everyday corporate overhead (like salaries, marketing, and keeping the lights on). | +5.3% | +1587.2% | +170.6% |
| Net MarginThe final take-home percentage. When you strip away every conceivable cost, tax, and interest payment, this is the exact number of cents the company truly gets to keep from every dollar in sales. | +6.8% | +494.2% | -1.0% |
| Free Cash FlowThe holy grail of corporate cash. It's the spendable, physical money left over after the business pays for its daily operations AND buys the big, expensive upgrades (like new factories or servers) it needs to survive. This is the 'free' money they can use to pay dividends or buy back stock. | $2.2B | +20.6% | +138.1% |
| FCF MarginThe ultimate cash conversion rate. It shows how good the company is at turning regular sales directly into cold, hard, spendable cash. A high percentage means the business is an absolute cash-printing machine. | +15.8% | -5.7% | +115.8% |
| Debt / EquityThe financial risk gauge. It compares how much of the company's empire was built using borrowed money (loans) versus the owners' own money (shareholders). A high number means they are heavily leveraged and playing a riskier game; a low number means they are playing it safe. | 32.8% | +377.4% | +3.4% |
| Current RatioThe 12-month survival check. It simply compares the cash they have right now (plus things they can quickly turn into cash) against the immediate bills they absolutely must pay this year. A score above 1 means they have enough in the wallet to cover the upcoming bills without panicking. | 1.41x | -15.5% | -4.1% |
| Total AssetsThe absolute size of the company's empire. It bundles together absolutely everything of value they own—from the cash in the register and the inventory in the warehouse, to the software patents in the vault and the factories on the ground. | $19.7B | +53.0% | -0.8% |
| Metric | Annual (A vs E) | Annual Surprise | Quarter (A vs E) | Quarter Surprise |
|---|---|---|---|---|
| EPS Surprise | 2.13 vs 2.25 | -5.5% | 0.46 vs 0.83 | -44.5% |
| Revenue Surprise | $13.7B vs $13.8B | -0.4% | $4.5B vs $4.6B | -2.3% |
| Date | Executive | Title | Security | Side | Shares | Price |
|---|---|---|---|---|---|---|
| Aug 25, 2026 | Adarkar Prabir | officer: PRESIDENT AND COO | Class A Common Stock | A | 43,550 | $7.16 |
| Aug 25, 2026 | Adarkar Prabir | officer: PRESIDENT AND COO | Class A Common Stock | D | 2,413 | $227.75 |
| Aug 25, 2026 | Adarkar Prabir | officer: PRESIDENT AND COO | Class A Common Stock | D | 3,298 | $229.31 |
| Aug 25, 2026 | Adarkar Prabir | officer: PRESIDENT AND COO | Class A Common Stock | D | 4,600 | $230.44 |
| Aug 25, 2026 | Adarkar Prabir | officer: PRESIDENT AND COO | Class A Common Stock | D | 20,744 | $231.46 |
Operator: Hello, everyone. Thank you for joining us, and welcome to the DoorDash Q2 2026 Earnings Call. [Operator Instructions] I will now hand the call over to Weston Twigg. Please go ahead. Weston Twigg: Thanks, Connor. Good afternoon, everyone, and thanks for joining us for our Q2 2026 Earnings Call. I'm pleased to be joined today by Co-Founder, Chair and CEO Tony Xu; and CFO, Ravi Inukonda. We'll be making forward-looking statements during today's call, including without limitation, our expectations for our business, financial position, operating performance, profitability, our guidance, strategies, capital allocation approach, and broader economic environment. Forward-looking statements are subject to risks and uncertainties that could cause actual results to differ materially from those described. Many of these uncertainties are described in our SEC filings, including our most recent Form 10-K and 10-Q. You should not rely on forward-looking statements as predictions of future events or performance. We disclaim any obligation to update any forward-looking statements except as required by law. During this call, we will discuss certain non-GAAP financial measures. Information regarding our non-GAAP financial measures, including a reconciliation of such non-GAAP measures to the most directly comparable GAAP financial measures may be found in our earnings release, which is available on our Investor Relations website at ir.doordash.com. These non-GAAP measures should be considered in addition to our GAAP results and are not intended to be a substitute for our GAAP results. Finally, this call is being audio webcasted on our Investor Relations website. An audio replay of the call will be available on our website shortly after the call ends. Operator, I'll pass it back to you, and we can take our first question. Operator: [Operator Instructions] The first question comes from Michael Morton of MoffettNathanson. Michael Morton: I wanted to ask about the grocery business as you've talked about improving the unit economics. From our understanding, there are some grocers on the platforms who are -- your platform specifically, who are paying effectively zero or very low take rates, they came on, looking to see as you could drive demand and how well they could work with DoorDash. I was wondering if that's the case and then what the opportunity is to reprice these relationships going forward, maybe pushing some of the affordability burden that's lending on DoorDash right now back to the grocers. Tony Xu: Yes. Michael, it's Tony. I can start and feel free to chime in, Ravi. What I would say is like we see extremely strong performance in our grocery business. It's the fast-growing part of our marketplace business and we have very healthy relationships with all of the partners on the platform. I mean in terms of the economic relationships, I'm not going to really comment about anyone in particular. I mean what I will say is that when you are the fastest …
| Name | Title | Compensation | Gender | Year Born | Status |
|---|---|---|---|---|---|
Prabir Adarkar | President & Chief Operating Officer | USD 457,729 | Male | 1978 | Active |
Keith Yandell | Chief Business Officer | USD 447,579 | Male | 1980 | Active |
Tony Xu | Co-Founder, Chief Executive Officer & Chair | USD 431,864 | Male | 1985 | Active |
Ravi Inukonda | Chief Financial Officer | USD 373,520 | Male | 1977 | Active |
Tia Sherringham | General Counsel & Secretary | USD 366,536 | Female | 1982 | Active |
Andy Fang | Head of LaunchPad & Director | USD 357,610 | Male | 1993 | Active |
Stanley Tang | Head of DoorDash Labs & Director | USD 357,399 | Male | 1994 | Active |
Gordon Lee | Chief Accounting Officer | — | Male | 1979 | Active |
Andrew Rex Hargreaves | Vice President of Investor Relations | — | Male | — | Active |
Ali Musa | Director of Corporate Communications | — | — | — | Active |
Moderna jumped 177% on a cancer-vaccine first, plus retail's reversal
After yesterday's announcement that the U.S. Treasury was adding liquidity to the long-term (30 year) bond market, we saw an immediate bump to pre-market indexes as bond yield rates dropped. In one day, that seems to have turned around: the 30-year bond is now back up to +5.25%, the 10-year at +4.71% and the 2-year +4.19%.

Shares of Serve Robotics (NASDAQ:SERV) are sinking 7% to $4.55 Tuesday afternoon, fully reversing Monday's Grubhub-fueled rally.

DoorDash, Inc. (Nasdaq: DASH), a global leader in local commerce, and Gap, a global apparel and accessories retailer, today announced a partnership that makes i

SAN FRANCISCO--(BUSINESS WIRE)--DoorDash, Inc. (Nasdaq: DASH), a global leader in local commerce, and Gap, a global apparel and accessories retailer, today announced a partnership that makes it easier than ever for consumers to shop the styles they love on-demand, just in time for back-to-school. Consumers nationwide can now get their favorites for the whole family, from kids' first-day fits to everyday fall essentials, delivered to their doors through DoorDash. Gap Factory is also joining the.