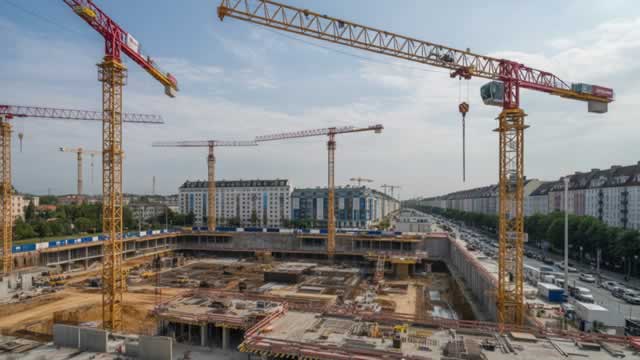
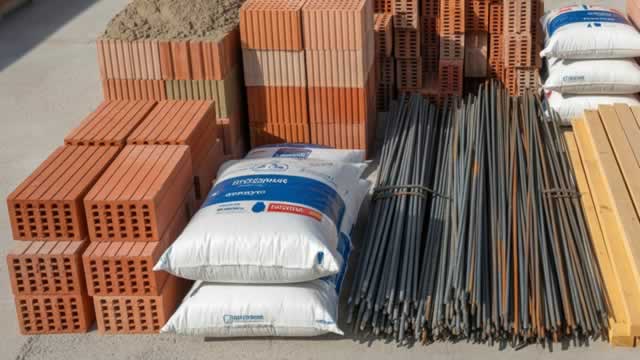
BlueLinx Holdings Inc., operating alongside its various divisions, is a prominent supplier of construction materials for both residential and commercial projects across ...
BlueLinx Holdings Inc., operating through its wholly-owned subsidiary BlueLinx Corporation, is a prominent wholesale distributor of building products in the United States. Founded in 2004 and headquartered in Marietta, Georgia, the company provides a comprehensive portfolio of over 10,000 specialty and commodity building products from well-respected brands, as well as ...BlueLinx Holdings Inc., operating through its wholly-owned subsidiary BlueLinx Corporation, is a prominent wholesale distributor of building products in the United States. Founded in 2004 and headquartered in Marietta, Georgia, the company provides a comprehensive portfolio of over 10,000 specialty and commodity building products from well-respected brands, as well as private-label offerings. Its product range includes engineered wood, lumber, plywood, oriented strand boards (OSB), rebar, insulation, metal products, cedar, trim, cladding, and other structural components essential for both residential and commercial construction.
BlueLinx serves a diverse customer base, including independent dealers, specialized distributors, major home improvement retailers, and pre-fabricated housing manufacturers. The company operates as a two-step distributor, supplying materials to dealers who then serve contractors and builders, and also directly to large retail chains. With a vast logistics network of strategically located distribution facilities across the U.S., BlueLinx ensures efficient delivery and supply chain solutions for its clients.
Financially, BlueLinx has demonstrated resilience in the cyclical building materials industry. As of the latest TTM data, the company reported a market capitalization of approximately $699 million, with revenue per share of $385.36. Despite a slight negative net profit margin (-0.1%), the company maintains a strong current ratio of 4.007 and a debt-to-equity ratio of 1.08, indicating manageable leverage. Free cash flow per share stands at $7.43, with a free cash flow yield of 8.3%, reflecting capacity for reinvestment and shareholder returns. The company has also paid dividends, with the last dividend at $5.00 per share.
Leadership is headed by President and CEO Shyam K. Reddy, who assumed the role in March 2023. Prior to his current position, he served in various executive roles, bringing extensive experience. The executive team includes Chief Human Resources Officer Keisha Duck, Chief Information Officer Praveen Gautam, and other key leaders. BlueLinx employs approximately 2,160 full-time employees, classified as a mid-sized company in the distribution sector.
The company is committed to providing value-added services, including logistics, inventory management, and marketing support, to enhance customer and vendor partnerships. With its strong market position, extensive product breadth, and robust distribution network, BlueLinx is well-positioned to capitalize on U.S. construction and remodeling demand, while navigating economic cycles through strategic cost management and operational efficiency.
YoYYoY means Year-over-Year. It compares the latest annual value with the previous annual value to show long-term trend strength.
QoQQoQ means Quarter-over-Quarter. It compares the latest quarter with the immediately previous quarter to show short-term momentum changes.
RevenueThe total money that came through the front door from selling things, before paying a single bill. Think of it as the grand total of every credit card swipe from customers. (YoY compares this year to last year's performance, while QoQ compares the current three months to the previous three).
$3.0B
+0.0%
+11.3%
Net IncomeThe absolute bottom line. If the company paid every single supplier, employee, banker, and tax collector, this is the actual money left in their pocket at the end of the day.
$219000
-99.6%
+539.4%
Gross MarginThe basic markup. If they sell a $100 pair of sneakers, this percentage tells you how much of that price tag is profit right after paying for the rubber and shoelaces, but before paying for things like store rent or TV commercials.
+15.3%
-7.7%
+7.8%
Operating MarginThe 'day job' efficiency score. Out of every dollar a customer spends, this shows how many cents the company keeps after making the product AND paying for all the everyday corporate overhead (like salaries, marketing, and keeping the lights on).
+1.1%
-62.9%
+152.5%
Net MarginThe final take-home percentage. When you strip away every conceivable cost, tax, and interest payment, this is the exact number of cents the company truly gets to keep from every dollar in sales.
+0.0%
-99.6%
+494.6%
Free Cash FlowThe holy grail of corporate cash. It's the spendable, physical money left over after the business pays for its daily operations AND buys the big, expensive upgrades (like new factories or servers) it needs to survive. This is the 'free' money they can use to pay dividends or buy back stock.
$32.9M
-27.1%
+114.7%
FCF MarginThe ultimate cash conversion rate. It shows how good the company is at turning regular sales directly into cold, hard, spendable cash. A high percentage means the business is an absolute cash-printing machine.
+1.1%
-27.1%
+113.2%
Debt / EquityThe financial risk gauge. It compares how much of the company's empire was built using borrowed money (loans) versus the owners' own money (shareholders). A high number means they are heavily leveraged and playing a riskier game; a low number means they are playing it safe.
109.2%
+10.9%
-0.3%
Current RatioThe 12-month survival check. It simply compares the cash they have right now (plus things they can quickly turn into cash) against the immediate bills they absolutely must pay this year. A score above 1 means they have enough in the wallet to cover the upcoming bills without panicking.
4.66x
-4.0%
+2.8%
Total AssetsThe absolute size of the company's empire. It bundles together absolutely everything of value they own—from the cash in the register and the inventory in the warehouse, to the software patents in the vault and the factories on the ground.
Operator: Ladies and gentlemen, thank you for standing by, and welcome to the BlueLinx Holdings Inc. First Quarter 2026 Earnings Conference Call. At this time, all participants are in a listen-only mode, and today’s call is being recorded. We will begin with opening remarks and introductions. At this time, I would like to turn the conference over to your host, Investor Relations Officer, Thomas C. Morabito. Please go ahead.
Thomas C. Morabito: Thank you, Operator, and welcome to the BlueLinx Holdings Inc. first quarter 2026 earnings call. Joining me on today’s call are Shyam K. Reddy, our Chief Executive Officer, and Christopher Kelly Wall, our Chief Financial Officer and Treasurer. At the end of today’s prepared remarks, we will take questions. Our first quarter news release and Form 10-Q were issued yesterday after the close of the market, along with our webcast presentation, and these items are available in the Investors section of our website. We encourage you to follow along with the detailed information on the slides during our discussion. Today’s discussion contains forward-looking statements. Actual results may differ significantly from those forward-looking statements due to various risks and uncertainties, including the risks described in our most recent SEC filings. Today’s presentation includes certain non-GAAP and adjusted financial measures that we believe provide helpful context for investors evaluating our business. Reconciliations to the closest GAAP financial measure can be found in the appendix of our presentation. Now I will turn it over to Shyam.
Shyam K. Reddy: Thanks, Tom. Good morning, everyone. We are off to a good start in 2026, as our first quarter results reflect our ability to compete effectively and deliver positive performance despite market headwinds, unforeseen cost inflation, and competitive pricing pressure. Our disciplined approach to executing our channel and product strategies enabled us to manage margins and to continue growing volumes across multiple product categories and key customer channels. During the first quarter, revenues increased 3% year-over-year, driven primarily by Distero specialty sales and higher volumes in our key specialty product categories, which helped offset ongoing pricing pressure in specialty and structural products and margin pressure in specialty products. Specialty and structural gross margins were 18.1% and 10.9%, respectively, reflecting the strength of our customer value proposition and effective inventory management. Our specialty product strategy continues to deliver results, with engineered wood, siding, millwork, industrial, outdoor living products, and other specialty products representing 70% of net sales and approximately 80% of gross profit in the quarter. While overall market conditions remain soft, our deliberate alignment of key supplier branded product expansion with strategic channel growth initiatives is enabling us to drive better commercial outcomes and …