GuruFocus8/12/2026Neutral
BDX DCF Analysis: Intrinsic Value $141 vs Price $181
On August 12, 2026, we delve into the DCF analysis for Becton Dickinson and Co (BDX), a company that has shown notable price performance recently, with a year-to-
Operating globally, Becton, Dickinson and Company (BD) is a prominent enterprise focused on the development, manufacturing, and distribution of a broad spectrum ...
Plutux is not an investment adviser. Market data and AI-generated analysis are for information and education only, not investment advice. Disclaimer
$4.19 per share
$4.19 per share
Est. EPS $12.67 · Revenue $19.29B · 8 analysts
Est. EPS $2.73 · Revenue $4.58B · 6 analysts
EPS $2.00 · Revenue $5.51B
EPS $1.07 · Revenue $5.27B
| Metric | Latest | YoYYoY means Year-over-Year. It compares the latest annual value with the previous annual value to show long-term trend strength. | QoQQoQ means Quarter-over-Quarter. It compares the latest quarter with the immediately previous quarter to show short-term momentum changes. |
|---|---|---|---|
| RevenueThe total money that came through the front door from selling things, before paying a single bill. Think of it as the grand total of every credit card swipe from customers. (YoY compares this year to last year's performance, while QoQ compares the current three months to the previous three). | $21.8B | +8.2% | +5.7% |
| Net IncomeThe absolute bottom line. If the company paid every single supplier, employee, banker, and tax collector, this is the actual money left in their pocket at the end of the day. | $1.7B | -1.6% | +221.2% |
| Gross MarginThe basic markup. If they sell a $100 pair of sneakers, this percentage tells you how much of that price tag is profit right after paying for the rubber and shoelaces, but before paying for things like store rent or TV commercials. | +45.4% | +0.5% | +1.7% |
| Operating MarginThe 'day job' efficiency score. Out of every dollar a customer spends, this shows how many cents the company keeps after making the product AND paying for all the everyday corporate overhead (like salaries, marketing, and keeping the lights on). | +11.8% | -0.6% | +567.2% |
| Net MarginThe final take-home percentage. When you strip away every conceivable cost, tax, and interest payment, this is the exact number of cents the company truly gets to keep from every dollar in sales. | +7.7% | -9.1% | +214.7% |
| Free Cash FlowThe holy grail of corporate cash. It's the spendable, physical money left over after the business pays for its daily operations AND buys the big, expensive upgrades (like new factories or servers) it needs to survive. This is the 'free' money they can use to pay dividends or buy back stock. | $2.7B | -13.1% | -6.8% |
| FCF MarginThe ultimate cash conversion rate. It shows how good the company is at turning regular sales directly into cold, hard, spendable cash. A high percentage means the business is an absolute cash-printing machine. | +12.2% | -19.7% | -11.8% |
| Debt / EquityThe financial risk gauge. It compares how much of the company's empire was built using borrowed money (loans) versus the owners' own money (shareholders). A high number means they are heavily leveraged and playing a riskier game; a low number means they are playing it safe. | 75.5% | -9.4% | -3.9% |
| Current RatioThe 12-month survival check. It simply compares the cash they have right now (plus things they can quickly turn into cash) against the immediate bills they absolutely must pay this year. A score above 1 means they have enough in the wallet to cover the upcoming bills without panicking. | 1.11x | -4.7% | -8.1% |
| Total AssetsThe absolute size of the company's empire. It bundles together absolutely everything of value they own—from the cash in the register and the inventory in the warehouse, to the software patents in the vault and the factories on the ground. | $55.3B | -3.4% | -0.2% |
| Metric | Annual (A vs E) | Annual Surprise | Quarter (A vs E) | Quarter Surprise |
|---|---|---|---|---|
| EPS Surprise | 5.83 vs 11.30 | -48.4% | 1.37 vs 3.14 | -56.4% |
| Revenue Surprise | $21.8B vs $21.9B | -0.1% | $5.0B vs $4.9B | +2.0% |
| Date | Executive | Title | Security | Side | Shares | Price |
|---|---|---|---|---|---|---|
| Aug 26, 2026 | Feld Michael | officer: EVP, Chief Revenue Officer | Common Stock | D | 165 | $188.49 |
| Aug 20, 2026 | Feld Michael | officer: EVP, Chief Revenue Officer | Common Stock | D | 1,049 | — |
| Aug 13, 2026 | Polen Thomas E Jr | director, officer: Chairman, CEO and President | Common Stock | A | 43,278 | $167.25 |
| Aug 13, 2026 | Polen Thomas E Jr | director, officer: Chairman, CEO and President | Common Stock | D | 39,126 | $185.00 |
| Aug 13, 2026 | Polen Thomas E Jr | director, officer: Chairman, CEO and President | Common Stock | D | 4,152 | $185.00 |
Operator: Hello, and welcome to BD's Third Fiscal Quarter 2026 Earnings Call. At the request of BD, today's call is being recorded and will be available for replay on BD's Investor Relations website, investors.bd.com or by phone at (800) 688-9445 for domestic calls and area code +1 402-220-1371 for international calls. [Operator Instructions] I will now turn the call over to Shawn Bevec, Senior Vice President, Investor Relations. Please go ahead. Shawn Bevec: Good morning, and welcome to BD's earnings call. I'm Shawn Bevec, Senior Vice President of Investor Relations. Thank you for joining us. This call is being made available via audio webcast at bd.com. Earlier this morning, BD released its results for the third quarter of fiscal 2026. The press release and presentation can be accessed on the IR website at investors.bd.com. Leading today's call are Tom Polen, BD's Chairman, Chief Executive Officer and President; and Vitor Roque, Executive Vice President and Chief Financial Officer. Before we get started, I want to remind you that we will be making forward-looking statements. You can read the disclaimer in our earnings release and the disclosures in our SEC filings on our Investor Relations website. Unless otherwise specified, all comparisons will be made on a year-on-year basis versus the relevant fiscal period. Revenue percentage changes are on an FX-neutral basis unless otherwise noted. Also, references to adjusted EPS refer to adjusted diluted EPS. Financials discussed here and included in the earnings release and 10-Q are presented on a continuing operations basis. Prior periods have been recast to reflect the spin-off of our Life Sciences business in combination with Waters, which is now accounted for as discontinued operations. Reconciliations between GAAP and non-GAAP measures are included in the appendices of the earnings release and presentation. With that, I will turn it over to Tom. Thomas Polen: Thank you, Shawn, and good morning, everyone. We delivered a strong third quarter with revenue, adjusted operating margin and adjusted EPS all ahead of our expectations. This was our first full quarter operating as New BD. And more importantly, the quality of this performance reflects our more focused portfolio beginning to demonstrate the growth and earnings potential we designed it to deliver. Performance was broad-based, reflecting commercial momentum across our key growth platforms, strong operational execution and the expanding impact of BD Excellence. Revenue was $5 billion, up 4.4% with more than 90% of the portfolio delivering high single-digit growth. Performance continues to be driven by ongoing structural improvements across our key growth platforms, where we've been focused on enhancing commercial execution and driving product innovation. This includes double-digit growth across biologic drug delivery, advanced patient monitoring, PureWick and advanced tissue regeneration, along with strong performance in peripheral vascular …
| Name | Title | Compensation | Gender | Year Born | Status |
|---|---|---|---|---|---|
Thomas E. Polen Jr. | President, Chief Executive Officer & Chairman | USD 3,588,724 | Male | 1973 | Active |
Michael C. Feld | Executive VP & Chief Revenue Officer | USD 1,910,642 | Male | 1981 | Active |
Vitor Roque | Executive Vice President & Chief Financial Officer | USD 1,777,376 | Male | 1983 | Active |
Michael Garrison | Executive VP & President of Medical Segment and BioPharma Systems Segments | USD 1,360,526 | Male | 1970 | Active |
Meera Gopalakrishnan | Senior VP & Global Chief Marketing Officer | — | Female | — | Active |
Shawn C. Bevec | Senior Vice President of Investor Relations | — | Male | — | Active |
Carla Burigatto | Senior Vice President & Chief Communications Officer | — | — | — | Active |
Joseph Smith | Senior Vice President & Chief Scientific Officer | — | — | — | Active |
Denise Fleming | Executive Vice President & Chief Information Officer | — | Female | 1971 | Active |
Elizabeth McCombs | Executive Vice President & Chief Technology Officer | — | Female | 1977 | Active |
Lanesha T. Minnix | Executive Vice President & General Counsel | — | Female | 1975 | Active |
On August 12, 2026, we delve into the DCF analysis for Becton Dickinson and Co (BDX), a company that has shown notable price performance recently, with a year-to-
Enrollment completed in the first large-scale randomized study evaluating Phasix™ Mesh for incisional hernia prevention, a significant unmet need following abdominal surgery FRANKLIN LAKES, N.J., Aug. 12, 2026 /PRNewswire/ -- BD (Becton, Dickinson and Company) (NYSE: BDX), a leading global medical technology company, today announced a significant milestone in its advanced tissue regeneration strategy and expansion efforts with successful completion of enrollment in the PREVENT clinical trial evaluating Phasix™ Mesh for the prevention of incisional hernias.

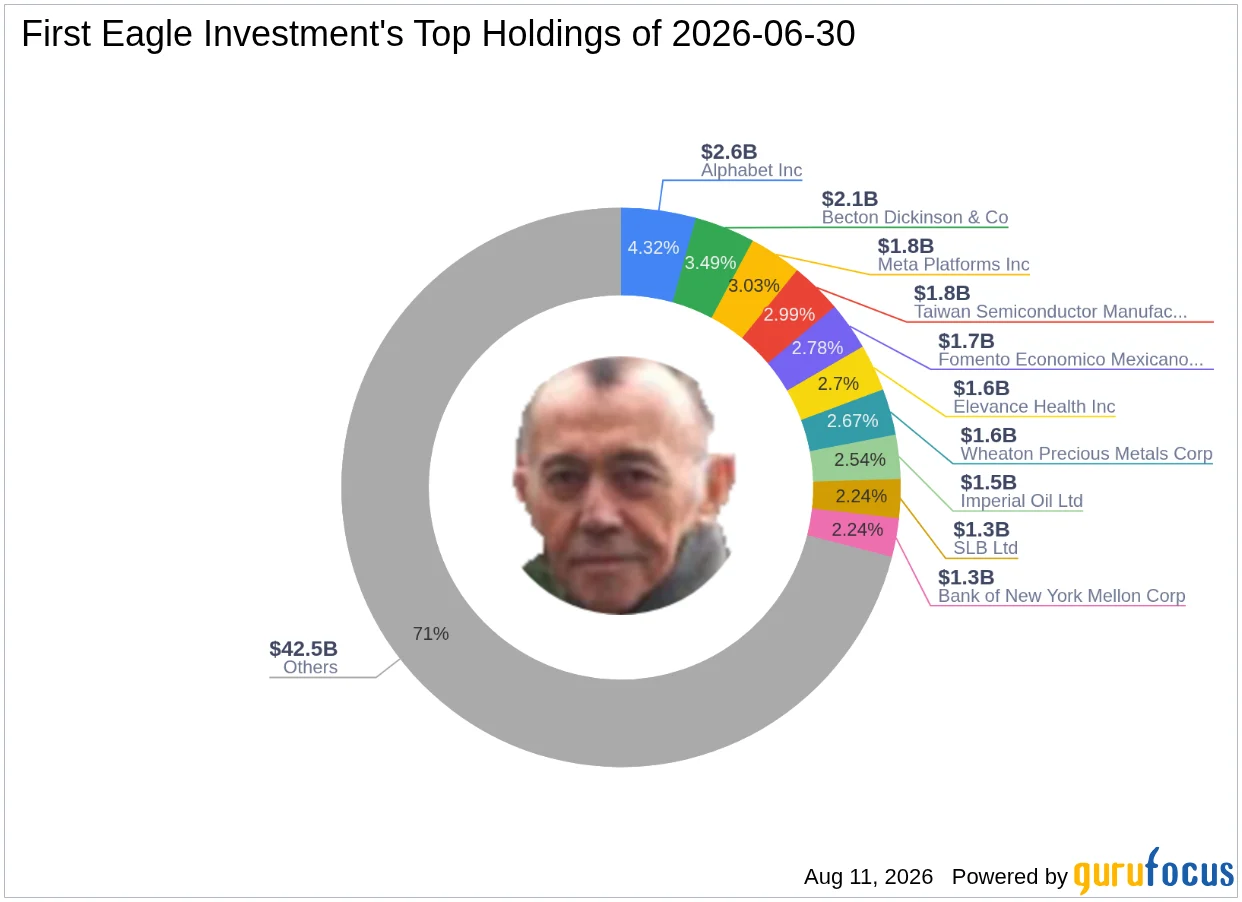
On June 30, 2026, First Eagle Investment (Trades, Portfolio) executed a significant add transaction for Becton Dickinson and Co (NYSE: BDX), increasing the firm's
About a year ago, 24/7 Wall St. flagged four overlooked Dividend Aristocrats as stealth growth plays, arguing that boring income names carried real upside if the market ever noticed.

Revenue: $5 billion, up 4.4% on an FX-neutral basis.Adjusted Operating Margin: 24.9%, down 130 basis points versus the prior year.Adjusted Gross Margin: 54.3%,