Alexander’s, Inc. is a real estate investment trust (REIT) engaged in leasing, managing, developing and redeveloping properties. Alexander’s activities are conducted through ...
Alexander's, Inc. is a publicly traded real estate investment trust, or REIT, headquartered in Paramus, New Jersey. The company traces its origins to 1928, when it was established as a New York department-store business by George Farkas and Louis Schwadron. Although its historical identity was associated with retail stores, its ...Alexander's, Inc. is a publicly traded real estate investment trust, or REIT, headquartered in Paramus, New Jersey. The company traces its origins to 1928, when it was established as a New York department-store business by George Farkas and Louis Schwadron. Although its historical identity was associated with retail stores, its present-day business is focused primarily on owning and operating commercial real estate in the broader New York City metropolitan region.
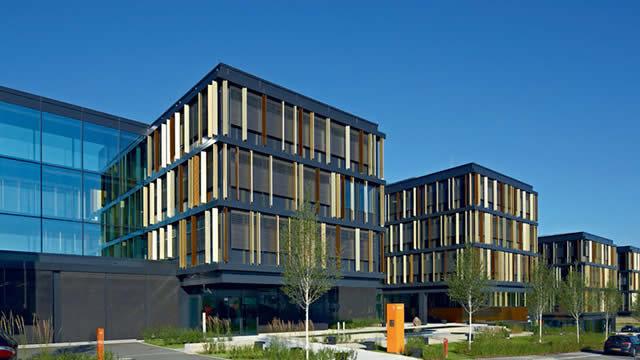
The company owns a highly concentrated portfolio of seven properties. Its assets include prominent office, retail, and mixed-use real estate, with 731 Lexington Avenue in Manhattan being one of its best-known properties. The portfolio's concentration in the New York metropolitan area gives Alexander's exposure to a high-value, supply-constrained real estate market, but it also creates geographic and tenant-concentration risk. Alexander's activities include leasing space to tenants, managing properties, developing new projects, and redeveloping or repositioning existing assets. Day-to-day management is conducted through Vornado Realty Trust, a major real estate company and a significant strategic relationship for Alexander's.
Alexander's does not operate a conventional manufacturing or product business. Consequently, traditional product costs, bill of materials, research and development, and inventory metrics are generally not meaningful for evaluating the company. Its principal cost structure typically relates to property operating expenses, real estate taxes, maintenance, utilities, insurance, repairs, redevelopment spending, professional services, interest expense, and corporate administration. Capital expenditures are directed toward maintaining, improving, leasing, and redeveloping properties rather than producing physical goods.
Based on the supplied trailing-twelve-month data, Alexander's reported approximately $1.41 billion in market capitalization and approximately $1.89 billion in enterprise value. The data indicates a debt-to-assets ratio of about 69.4%, a debt-to-equity ratio of approximately 3.73, and an enterprise-value-to-EBITDA multiple of about 7.42. The company also showed a trailing dividend yield of approximately 6.5%, with dividend payments of $18 per share in the supplied data. These figures should be interpreted in the context of REIT accounting, where funds from operations, adjusted funds from operations, occupancy, rental income, lease maturities, and property-level net operating income are often more informative than standard industrial-company earnings measures.
Steven Roth serves as chairman and chief executive officer. Alexander's had approximately 103 full-time employees in the supplied company profile, while Vornado Realty Trust provides important management and operating capabilities. Key investment considerations include the quality and location of the properties, tenant demand for Manhattan and metropolitan New York office and retail space, refinancing requirements, interest rates, redevelopment opportunities, dividend sustainability, and the company's ability to preserve or increase property cash flows. Overall, Alexander's is best characterized as a small, specialized, asset-heavy REIT with a valuable but concentrated New York-area real estate portfolio rather than as a traditional retail operating company.
YoYYoY means Year-over-Year. It compares the latest annual value with the previous annual value to show long-term trend strength.
QoQQoQ means Quarter-over-Quarter. It compares the latest quarter with the immediately previous quarter to show short-term momentum changes.
RevenueThe total money that came through the front door from selling things, before paying a single bill. Think of it as the grand total of every credit card swipe from customers. (YoY compares this year to last year's performance, while QoQ compares the current three months to the previous three).
$213.2M
-5.8%
+2.4%
Net IncomeThe absolute bottom line. If the company paid every single supplier, employee, banker, and tax collector, this is the actual money left in their pocket at the end of the day.
$28.2M
-35.0%
+3232.5%
Gross MarginThe basic markup. If they sell a $100 pair of sneakers, this percentage tells you how much of that price tag is profit right after paying for the rubber and shoelaces, but before paying for things like store rent or TV commercials.
+16.1%
-83.9%
+118.6%
Operating MarginThe 'day job' efficiency score. Out of every dollar a customer spends, this shows how many cents the company keeps after making the product AND paying for all the everyday corporate overhead (like salaries, marketing, and keeping the lights on).
+30.6%
-15.4%
+15.3%
Net MarginThe final take-home percentage. When you strip away every conceivable cost, tax, and interest payment, this is the exact number of cents the company truly gets to keep from every dollar in sales.
+13.2%
-31.0%
+3153.4%
Free Cash FlowThe holy grail of corporate cash. It's the spendable, physical money left over after the business pays for its daily operations AND buys the big, expensive upgrades (like new factories or servers) it needs to survive. This is the 'free' money they can use to pay dividends or buy back stock.
$73.4M
+35.7%
-104.3%
FCF MarginThe ultimate cash conversion rate. It shows how good the company is at turning regular sales directly into cold, hard, spendable cash. A high percentage means the business is an absolute cash-printing machine.
+34.5%
+44.1%
-104.2%
Debt / EquityThe financial risk gauge. It compares how much of the company's empire was built using borrowed money (loans) versus the owners' own money (shareholders). A high number means they are heavily leveraged and playing a riskier game; a low number means they are playing it safe.
864.0%
+38.5%
-63.2%
Current RatioThe 12-month survival check. It simply compares the cash they have right now (plus things they can quickly turn into cash) against the immediate bills they absolutely must pay this year. A score above 1 means they have enough in the wallet to cover the upcoming bills without panicking.
8.33x
-34.9%
+93.6%
Total AssetsThe absolute size of the company's empire. It bundles together absolutely everything of value they own—from the cash in the register and the inventory in the warehouse, to the software patents in the vault and the factories on the ground.