Fool - Investing News8/16/2026Neutral
2 Stocks Down 15% and 30% to Buy Right Now and Hold for the Next Decade
Two category leaders are still off their highs, yet continue to report double-digit revenue growth.

Airbnb, Inc., along with its affiliated entities, manages a global digital marketplace. This platform seamlessly connects individuals, known as hosts, who wish ...
Plutux is not an investment adviser. Market data and AI-generated analysis are for information and education only, not investment advice. Disclaimer
Est. EPS $2.85 · Revenue $4.74B · 22 analysts
Est. EPS $0.84 · Revenue $3.16B · 21 analysts
Est. EPS $5.28 · Revenue $14.16B · 29 analysts
Est. EPS $0.41 · Revenue $3.01B · 15 analysts
| Metric | Latest | YoYYoY means Year-over-Year. It compares the latest annual value with the previous annual value to show long-term trend strength. | QoQQoQ means Quarter-over-Quarter. It compares the latest quarter with the immediately previous quarter to show short-term momentum changes. |
|---|---|---|---|
| RevenueThe total money that came through the front door from selling things, before paying a single bill. Think of it as the grand total of every credit card swipe from customers. (YoY compares this year to last year's performance, while QoQ compares the current three months to the previous three). | $12.3B | +10.8% | +34.7% |
| Net IncomeThe absolute bottom line. If the company paid every single supplier, employee, banker, and tax collector, this is the actual money left in their pocket at the end of the day. | $2.5B | -5.2% | +410.0% |
| Gross MarginThe basic markup. If they sell a $100 pair of sneakers, this percentage tells you how much of that price tag is profit right after paying for the rubber and shoelaces, but before paying for things like store rent or TV commercials. | +72.3% | -13.0% | +24.7% |
| Operating MarginThe 'day job' efficiency score. Out of every dollar a customer spends, this shows how many cents the company keeps after making the product AND paying for all the everyday corporate overhead (like salaries, marketing, and keeping the lights on). | +21.2% | -7.8% | +570.7% |
| Net MarginThe final take-home percentage. When you strip away every conceivable cost, tax, and interest payment, this is the exact number of cents the company truly gets to keep from every dollar in sales. | +20.4% | -14.4% | +278.5% |
| Free Cash FlowThe holy grail of corporate cash. It's the spendable, physical money left over after the business pays for its daily operations AND buys the big, expensive upgrades (like new factories or servers) it needs to survive. This is the 'free' money they can use to pay dividends or buy back stock. | $4.6B | +2.8% | -25.6% |
| FCF MarginThe ultimate cash conversion rate. It shows how good the company is at turning regular sales directly into cold, hard, spendable cash. A high percentage means the business is an absolute cash-printing machine. | +37.8% | -7.2% | -44.8% |
| Debt / EquityThe financial risk gauge. It compares how much of the company's empire was built using borrowed money (loans) versus the owners' own money (shareholders). A high number means they are heavily leveraged and playing a riskier game; a low number means they are playing it safe. | 27.7% | +1.6% | -3.6% |
| Current RatioThe 12-month survival check. It simply compares the cash they have right now (plus things they can quickly turn into cash) against the immediate bills they absolutely must pay this year. A score above 1 means they have enough in the wallet to cover the upcoming bills without panicking. | 1.38x | -18.5% | -2.4% |
| Total AssetsThe absolute size of the company's empire. It bundles together absolutely everything of value they own—from the cash in the register and the inventory in the warehouse, to the software patents in the vault and the factories on the ground. | $22.2B | +6.0% | +7.2% |
| Metric | Annual (A vs E) | Annual Surprise | Quarter (A vs E) | Quarter Surprise |
|---|---|---|---|---|
| EPS Surprise | 4.03 vs 4.13 | -2.4% | 1.37 vs 2.85 | -51.9% |
| Revenue Surprise | $12.3B vs $12.2B | +1.1% | $3.6B vs $4.7B | -23.9% |
| Date | Executive | Title | Security | Side | Shares | Price |
|---|---|---|---|---|---|---|
| Sep 1, 2026 | Bernstein David C | officer: Chief Accounting Officer | Class A Common Stock | A | 5,224 | $40.18 |
| Sep 1, 2026 | Bernstein David C | officer: Chief Accounting Officer | Class A Common Stock | D | 5,224 | $182.49 |
| Sep 1, 2026 | Bernstein David C | officer: Chief Accounting Officer | Stock Option | D | 5,224 | $40.18 |
| Aug 31, 2026 | Blecharczyk Nathan | director, 10 percent owner, officer: Chief Strategy Officer | Class B Common Stock | D | 17,692 | — |
| Aug 31, 2026 | Blecharczyk Nathan | director, 10 percent owner, officer: Chief Strategy Officer | Class A Common Stock | A | 17,692 | — |
Operator: Good afternoon. Thank you for joining Airbnb's earnings conference call for the second quarter of 2026. As a reminder, this conference call is being recorded and will be available for replay from the investor relations section of Airbnb's website following this call. I will now hand the call over to Andrew Slavin, Vice President of Investor Relations. Please go ahead. Andrew Slavin: Thank you so much. Good afternoon. Welcome to Airbnb's second quarter of 2026 earnings call. Thank you for joining us today. On the call with us, we have Airbnb's Co-founder and CEO, Brian Chesky, and our Chief Financial Officer, Ellie Mertz. Earlier today, we issued a shareholder letter with our financial results and commentary for our second quarter of 2026. These items are also posted on the investor relations section of Airbnb's website. During the call, we'll make brief opening remarks. We'll spend the remainder of time on Q&A. Before I turn it over to Brian, I would like to remind everyone that we will be making forward-looking statements on this call that involve a number of risks and uncertainties. Actual results may differ materially from those expressed or implied in the forward-looking statements due to a variety of factors. These factors are described under forward-looking statements in our shareholder letter and in our most recent filings with the Securities and Exchange Commission. That being said, we urge you to consider these factors and remind you that we undertake no obligation to update the information contained in this call to reflect subsequent events or circumstances. You should be aware that these statements should be considered estimates only and are not a guarantee of future performance. Also, during this call, we will discuss some non-GAAP financial measures. We provided reconciliations to the most directly comparable GAAP financial measures in the shareholder letter posted to our investor relations website. These non-GAAP measures are not intended to be a substitute for our GAAP results. With that, I'll pass the call over to Brian. Brian Chesky: All right. Thanks, Andrew. Good afternoon, everyone. Thanks for joining. Over the first half of 2026, we've delivered some of the strongest results in years. In Q2, that momentum accelerated. We exceeded our outlook across every key metric. Revenue grew 17% year-over-year to $3.6 billion. Gross booking value grew 16% year-over-year to $27.2 billion. Nights and seats booked grew 10% year-over-year, accelerating from Q1. We are seeing this momentum show up across the business. Nights booked on our app grew 23% year-over-year. They now account for 64% of total nights booked, which is up from 59% last year. More new guests are trying Airbnb than we've seen in years. In fact, growth among our first-time bookers accelerated to 11%. This is the highest growth that we have seen in four years. Among first-time bookers, the Gen Z cohort is growing the fastest. Our expansion markets continue to …
| Name | Title | Compensation | Gender | Year Born | Status |
|---|---|---|---|---|---|
Elinor Mertz | Chief Financial Officer | USD 1,361,006 | Female | 1977 | Active |
Nathan Blecharczyk | Co-Founder, Chief Strategy Officer & Director | USD 1,310,067 | Male | 1984 | Active |
Ahmad Al-Dahle | Chief Technology Officer | USD 1,124,095 | Male | — | Active |
Brian Chesky | Co-Founder, CEO & Chairman of the Board | USD 242,122 | Male | 1982 | Active |
Joseph Gebbia | Co-Founder & Director | USD 62,500 | Male | 1982 | Active |
Gus Fuldner | Global Head of Operations | — | Male | — | Active |
Jay Carney | Global Head of Policy & Communications | — | Male | — | Active |
Ronald A. Klain | Chief Legal Officer | — | Male | — | Active |
Angela Yang | Director of Investor Relations | — | Female | — | Active |
David Bernstein | Chief Accounting Officer | — | Male | 1962 | Active |
Two category leaders are still off their highs, yet continue to report double-digit revenue growth.
Revenue is soaring despite the macroeconomic headwinds.

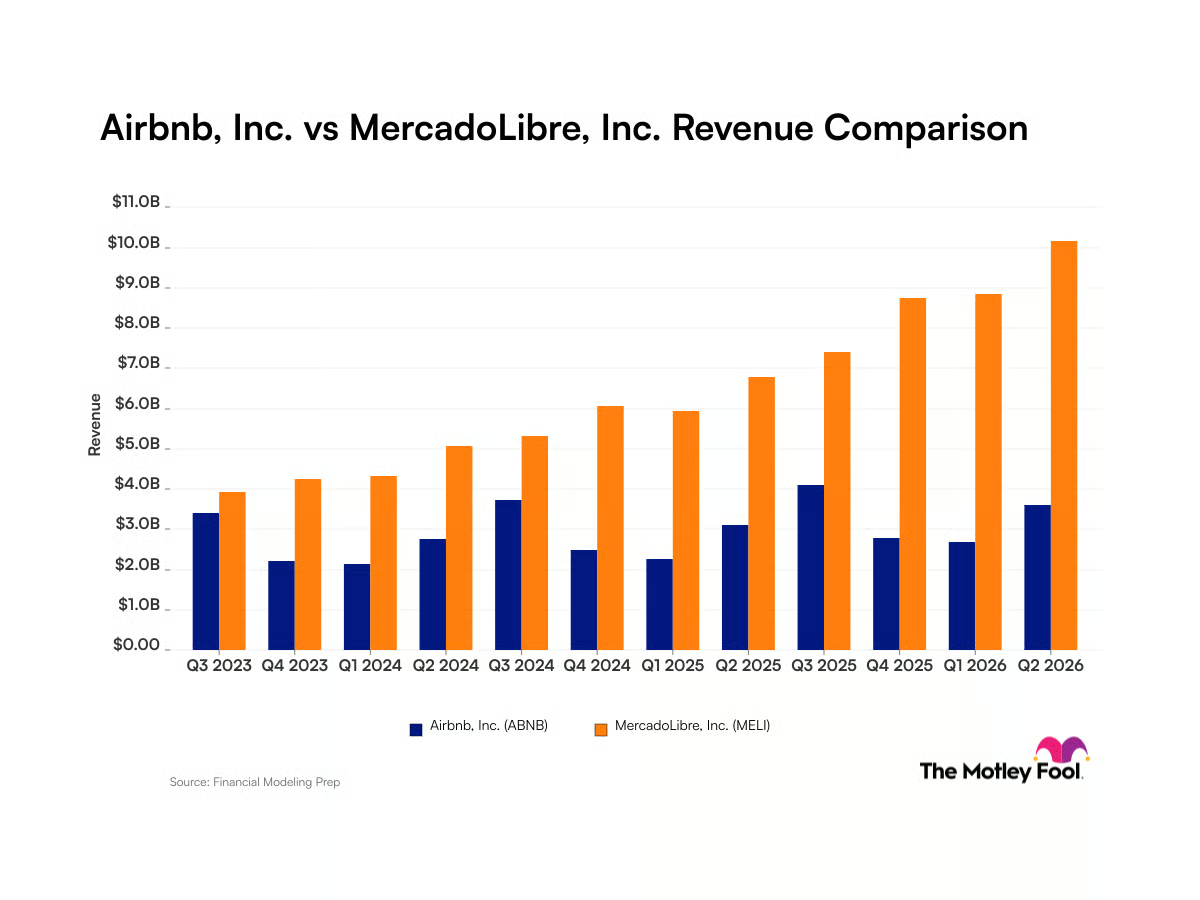
MercadoLibre has grown revenue every quarter for two years, while Airbnb swings wildly with the seasons - a stark contrast in consistency that reshapes how investors should compare them.
Shares of Airbnb, Inc. (ABNB) see eight institutional inflows in the past 30 days.
Nvidia turns financier, CAVA's traffic sizzles, Berkshire ends its 3-year drought, and more