
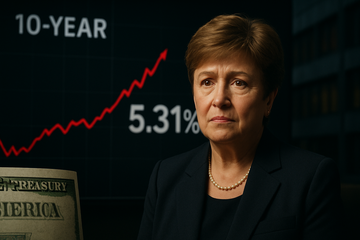
10-year Treasury yield, Oct 5, 2026 close
5.31%
Highest since May 2002; per US Treasury par yield curve
30-year Treasury yield, early-Oct 2026
5.73%
Per Foreign Policy account of Georgieva's Oct 7 remarks; highest since 2002
30-year fixed mortgage rate (Bankrate)
7.53%
Week of Oct 7, 2026; up from 7.38% the prior week and 6.39% a year earlier
U.S. public debt outstanding
$40.0T
Crossed $40T on Aug 19, 2026 per Treasury Debt to the Penny, Reuters
Fed funds target range
3.75–4.00%
Raised 25 bp at Sept 17, 2026 FOMC per Reuters/Forbes
Money-market fund assets, Oct 7, 2026
$7.96T
ICI weekly release; FRED end-of-period reading $8.44T
The IMF event
Georgieva Tells Governments That Growth Alone Can't Fix $40T Of Debt
Speaking from Singapore on October 7 ahead of the IMF's October 13 World Economic Outlook release, Managing Director Kristalina Georgieva walked up to a politically uncomfortable line: economic policy chiefs \"cannot keep delaying\" the choice between belt-tightening and a fiscal reckoning, with public debt loads so heavy that even the IMF's upgraded world growth call of 3.1% for 2026 cannot outrun interest costs. The precise instrument is fiscal — governments should run a \"prudently hawkish bias\" and prepare for \"very tough political choices\" — but the political timing turns the message into a market event.
The WEO backdrop stiffens the message. Global growth was nudged up from 3.0% to 3.1% for 2026 (with 3.4% penciled in for 2027), U.S. GDP was held at 2.3% in 2026 and revised to 2.7% for 2027, and global headline inflation is now projected to hit 4.7% in 2026 before easing to 4.1% in 2027. None of those numbers — particularly 2.3%–2.7% U.S. real growth — is large enough, on a debt/GDP base north of 120%, to make the math work without tighter policy. As the IMF's WEO chapter put it bluntly, growth is now expected to \"edge down\" in 2027 on the back of higher energy prices and long-term rates.
The tape event
Bessent Capitulated Before The IMF Showed Up
| Date | 10-yr yield | 30-yr yield | What's happening |
|---|---|---|---|
| Sep 8, 2026 | 4.80% | ~5.0% | Baseline before the run-up (Bloomberg compilation) |
| Sep 30, 2026 | 5.34% | n/a | Senate Banking letter to Bessent; first 5.3%+ close in 24 years |
| Oct 5, 2026 (close) | 5.31% | 5.73% | 24-year high; touch of 5.349% intraday (CNBC, CalculatorAI) |
| Oct 7, 2026 | backed off 24-yr high | n/a | Solid 10-yr auction demand pushes yield off highs (CNBC) |
| Oct 8, 2026 | 5.22% | n/a | Macrotrends daily; still up 109 bp YoY |
Two days before Georgieva spoke, Treasury Secretary Scott Bessent did something no Treasury Secretary typically does on camera: he conceded, in an Axios interview on October 4, that \"I can't control the bond market. What I can do is try to get people to slow down and think.\" The walk-back from his earlier \"the house always wins\" framing — read by bond desks as a threat to short-sellers — was forced by a curve that didn't move on the doubled, $4 billion-plus buyback program Bessent expanded in August, nor on the U.S.-Japan coordinated yen support that was never about selling Treasuries in the first place.
- Bankrate's Oct 7 lender survey put the 30-year fixed at 7.53%, up 15 bp week-on-week and a 3-year high; the Freddie Mac PMMS weekly reading is 7.40% as of Oct 8.
- Trump's October 7 public criticism of the Federal Reserve for not cutting already pushed 30-year mortgages through 7.49% and effectively priced in another cut before the October 28–29 FOMC.
- Senator Elizabeth Warren sent Bessent an October 7 letter flagging 100+ bp of yield rise in nine months — the political feedback loop is open.
The funding test
The 10-Year Has To Choose Between A Trump Rate-Cut Refund And A Fiscal-Funding Blowout
Two narratives are competing for the same curve. The first, preferred by the White House, is that the September 17 FOMC hike to 3.75–4.00% was an inflation \"error\" that needs to be refunded with two more cuts by year-end — Trump explicitly tied this to mortgage rates in his October 7 comments. The second, written by the bond market itself, is that supply is winning: $40.0 trillion of total public debt outstanding (per Treasury's Debt-to-the-Penny file, crossing the threshold on August 19), a CBO-projected $1.9T FY 2026 deficit rising to $3.1T by 2036, and roughly $800 billion of hyperscaler capex in 2026 turning into a parallel IG-bond supply shock that crowds Treasuries out of the same bid stack.
AI-linked debt is now crowding Treasuries for the same marginal buyer
Goldman Sachs Research estimates of annual AI-related investment-grade issuance vs. the 2024–2026 trajectory.
Unit: USD billions / share %
2024
10
2025
108
2026 YTD (AI-related IG)
194
2026 capex debt-financed share (%)
33
The plumbing matters more than the narrative. Per Goldman Sachs Exchanges (Aug 5, 2026), hyperscalers issued $194 billion of IG debt YTD through early August, and AI-related issuance is now running at ~18% of IG supply with 40% of 15-year-plus tenor paper tied to AI infrastructure. Citi's October counterproposal — cut $3 billion per auction on both the 20- and 30-year at the November refunding — is itself a tacit admission that the funding math can't keep printing more long-duration paper into a market that's already paying 5.3%+ to lend it to Uncle Sam.
The cash pool
$8 Trillion Is Sitting Idle While Washington Borrows At 5.3%
The most under-discussed feature of the curve is what the marginal buyer refuses to do. ICI's Oct 8 weekly release pegged money-market fund assets at $7.96 trillion for the week ended Oct 7; FRED's Money Market Funds series ran end-of-period at $8.44 trillion. That pool is roughly equivalent to the entire U.S. dollar share of foreign-held Treasuries — and it earns 4%+ risk-free in T-bills rather than 5.3% in 10s. Treasury bills, per the Halftime public-funds note, account for an expected $800 billion of issuance over the back half of 2026. Until and unless the MMF industry widens its duration mandate, the long end is starved of its most obvious marginal buyer, and every recession scare or refund whisper becomes a 10-year tape event.
| Pool / yield | Size | Yield (Oct 2026) | Why it matters |
|---|---|---|---|
| Money-market funds (ICI) | $7.96T | ~4% | Sits in bills, refuses to extend to 10s |
| Money-market funds (FRED EoP) | $8.44T | ~4% | Series-level record; high-conviction cash bid |
| 10-year Treasury | n/a | 5.31% | Funding rate for ~$2T/yr of new Treasuries |
| AI-linked IG issuance (Goldman) | $194B YTD | spread ~100 bp over Treasuries | Crowds Treasury out of IG accounts |
| 30-yr fixed mortgage | n/a | 7.53% (Bankrate) | Tracks 10-yr + ~220 bp spread |
- Front-end yields (T-bills, money funds) are driving the cash bid; the 10-year funding cost is being set by an insufficient marginal buyer, not by policy rates.
- France's 10-year traded 4.93% and the UK 30-year gilt ~6% per Georgieva's Singapore speech — the U.S. yield problem is global, not idiosyncratic.
- Treasury's own TBAC has flagged structural-demand erosion across the curve, the same complaint Bessent cannot publicly make.
Winners and losers
Banks Trade The Volatility; Homebuilders And Mortgage REITs Pay The Bill
Q3 2026 earnings, all reported on October 13, immediately quantified who wins when the curve is misbehaving. JPMorgan Chase's net interest income jumped 13% YoY to $27.1 billion on revenue of $50.9 billion (+8%), lifting EPS to $5.57; the bank also raised 2026 EPS guidance to $11.05–$11.15. Goldman Sachs blew past estimates with net revenue of $18.68 billion (+23% YoY), EPS of $17.01, and a record 18.7% ROE — clearly a trading-revenue story. Citigroup reported revenue of $23.8 billion (+8%) and ROTCE of 11.5%, with fixed-income markets up 4%. Wells Fargo added 5% to NII for net income of $6.0 billion ($1.87 EPS). The combined picture: corporate and investment-banking desks collect on volatility, while deposit-funded NII at the regionals lifts with the Fed funds reset.
Downstream, the same curve that lifted bank trading crushed housing. Lennar's Q1 2026 adj. EPS missed by 8 cents as incentive spend hit ~14% of sales price; D.R. Horton closed fiscal Q3 2026 with $615.7M of buybacks, a defensive signal at the affordability limit; PulteGroup's Q1 2026 net income dropped 17% YoY to $472M. Mortgages REIT levered to agency MBS — AGNC Investment and Annaly Capital Management — face book-value erosion as the long MBS duration rolls in a 5%+ rate environment; both stocks trade well below their Q3 NAV marks per Morningstar's REIT screen.
Hyperscaler exposure
The AI Capex Story Meets Its Funding Reality Check
The MUFG note pegged the \"big five\" hyperscaler capex north of $600B in 2026 (~75% AI-specific). Per the Yahoo Finance capex roundup, Amazon's 2026 capex is around $200B, Alphabet's is $175–$185B, Meta's is $115–$135B, and Microsoft's already capex'd above $40B in fiscal Q3 2026 alone. Apple, at roughly 1.8% capex/revenue, is the only Mag 7 that isn't borrowing into the tape; everyone else is. If the 10-year stays at 5.3%, every incremental dollar of AI capex becomes 30–40 bp more expensive to finance than the model the sell side is using — a fact that explains why the Goldman Sachs research team is now explicitly tracking whether hyperscaler bond issuance will starve Treasuries of their buyer base.
- Hyperscaler debt-as-capex share rose from 9% in FY24 to 32% for the LTM through June 2026, per FactSet; aggregate hyperscaler debt is now ~$700B.
- Goldman projects 35% of capex debt-financed in 2027; CreditSights forecasts $450B of AI-specific capex this year, the same number that was modeled on lower rates.
- NVIDIA, as the upstream supplier, is structurally insulated from the funding shock — but its customers' bond calendars now matter for its forward order book.
Short-term vs. long-term
What The Next Two Quarters Versus The Next Two Years Look Like
Over days to weeks, the market is reacting to headlines, not fundamentals. The FOMC meeting on October 28–29 is the binary catalyst: with Polymarket pricing an 82% probability of a hold and ~18% on a surprise cut, even a dovish Powell press conference can pull the 10-year into the 5.10%–5.20% band, lowering the mortgage-rate tail risk that Q3 earnings — and Trump — are most sensitive to. Q4 brings the November Treasury quarterly refunding (Citi's prediction: $3B cuts at both the 20- and 30-year), and Bessent's most explicit supply test. The November 5 midterms remain a wild card; the IMF's word of caution, repeated at every press conference, becomes louder if any candidate starts talking about explicit Treasury issuance reform.
Over one to three years, the structural story is more unsettling than the cyclical. U.S. debt/GDP is on a CRFB-modeled path to 125% by 2036, the CBO sees $3.1T annual deficits by then, and global debt is on the IMF's path to 100% of GDP by 2029 — two years earlier than its previous estimate. In that regime, every delay in fiscal consolidation shaves the equity risk premium and widens the 10-year term premium. The trade isn't to short Treasuries outright — duration convexity makes that a volatility trade at best — it's to remain overweight the names that monetize the volatility (Goldman Sachs, JPMorgan Chase, Morgan Stanley, Citigroup) and underweight the names most levered to long-duration cash flows (D.R. Horton, Lennar, PulteGroup, AGNC Investment, Annaly Capital Management) until the spread between 10s and the policy rate normalizes.
Investable names
- Q3 2026 trading-revenue boom (revenue +23% YoY to $18.7B, EPS $17.01) turns a 5.31% 10-year into a P&L tailwind for the next several quarters.
- Hyperscaler IG underwriting (Goldman's call is ~$250B of 2026 direct supply) layers fee income on top of trading — the longer AI capex stays funded by debt, the more Goldman collects at the new issue concession.
- Bear case: any sustained yield drop on a Trump-engineered Fed refund is the trading-revenue trade unwinding the Q3 print.
- Q3 NII at $27.1B (+13% YoY) and 2026 EPS guidance raised to $11.05–$11.15 lock in the rate-volatility upside across the next two reporting cycles.
- Markets and Securities Services revenue at $5.4B (+7%) captures both fixed-income vol and FX hedging tied to the curve event.
- Cushion narrows if the Fed pivots dovish in October and front-end yields collapse; that's when NII stops surprising.
- Q3 equity-trading franchise consensus runs at the highest equities revenue in the group, ~$5.1B, the most cyclical exposure to the AI-IPO and capital-markets reopening now that curves have priced.
- Wealth-management AUM revaluation kicks in if the 10-year settles in a 5.0–5.3% band and the dollar stays firm.
- Watch: capital-markets fees stall if 10-year breaks 5.5% on the next refunding.
- Deposit-funded NII benefits from the Fed's September 25 bp reset to 3.75–4.00%; rate sensitivity is the largest of the money-center quartet.
- Mortgage-banking division sits on the wrong side of the 7.5%+ rate environment — origination volumes are likely to be cut in half year-over-year.
- Net direction: short-term bullish on NII, capped by mortgage-headwind drag until either the 10-year or the 30-year fixed moves.
- Mortgage at 7.53% with Bankrate's banker survey locks affordability pressure into the fall 2026 selling season; incentive spend per Lennar's Q1 2026 read is already at ~14% of sales price.
- Q3 FY 2026 buyback ($615.7M) signaled a defensive pull-in — typically a leading indicator of management's confidence flattening.
- Recovery requires the 30-year fixed below 6.5%, which the market is not pricing for any 2026 quarter.
- Q1 2026 net income down 17% YoY to $472M, with consensus projecting FY 2026 EPS down 12% — the next two quarterlies are unlikely to buck the affordability math.
- Q3 2026 report due October 22 — a guidance cut, not a beat, is the more probable path on these rates.
- Best case: 25 bp Fed cut on Oct 29 trims the 30-year fixed 15–20 bp, kicking Q4 orders.
- Book-value erosion accelerates as agency MBS duration rolls in a 5.3%+ 10-year; precedent says AGNC trades at a widening NAV discount through the first two quarters of any sustained sell-off.
- Dividend yield is the draw — once the 10-year reaches a stable level, the dividend-yield spread against 10s comps favors patient holders.
- Risk-reward turns on whether Fed reinvestment policy absorbs more MBS than Treasury auctions of long paper.
- Upstream of every hyperscaler on the list — book health is anchored to capex that those customers must borrow to fund.
- If MSFT/GOOGL/META/AMZN hyperscaler debt issuance spooks the 10-year above 5.5%, the implicit cost-of-capital of every new GPU order steps up; NVIDIA's forward orders stay booked but capex pacing by buyers is the risk.
- Earnings catalyst next: any capex guidance cut by a hyperscaler after Q4 is the lead indicator for NVIDIA's order book.