%22%2F%3E%0A%20%20%3Ccircle%20cx%3D%22220%22%20cy%3D%22150%22%20r%3D%22180%22%20fill%3D%22%2322d3ee%22%20fill-opacity%3D%220.12%22%2F%3E%0A%20%20%3Ccircle%20cx%3D%221010%22%20cy%3D%22130%22%20r%3D%22220%22%20fill%3D%22%2338bdf8%22%20fill-opacity%3D%220.08%22%2F%3E%0A%20%20%3Ccircle%20cx%3D%22920%22%20cy%3D%22520%22%20r%3D%22170%22%20fill%3D%22%2322d3ee%22%20fill-opacity%3D%220.06%22%2F%3E%0A%20%20%3Cpath%20d%3D%22M140%20430h920%22%20stroke%3D%22url(%23line)%22%20stroke-width%3D%2212%22%20stroke-linecap%3D%22round%22%2F%3E%0A%20%20%3Cpath%20d%3D%22M220%20360c120-150%20260-220%20380-220s260%2070%20380%20220%22%20fill%3D%22none%22%20stroke%3D%22%2367e8f9%22%20stroke-opacity%3D%220.5%22%20stroke-width%3D%2216%22%20stroke-linecap%3D%22round%22%20stroke-linejoin%3D%22round%22%2F%3E%0A%20%20%3Cpath%20d%3D%22M300%20398h600%22%20stroke%3D%22%2394a3b8%22%20stroke-opacity%3D%220.24%22%20stroke-width%3D%228%22%20stroke-linecap%3D%22round%22%2F%3E%0A%20%20%3Ctext%20x%3D%22220%22%20y%3D%22510%22%20fill%3D%22%23e2e8f0%22%20fill-opacity%3D%220.7%22%20font-family%3D%22Arial%2C%20Helvetica%2C%20sans-serif%22%20font-size%3D%2238%22%20letter-spacing%3D%228%22%3EINSIGHTS%3C%2Ftext%3E%0A%3C%2Fsvg%3E)
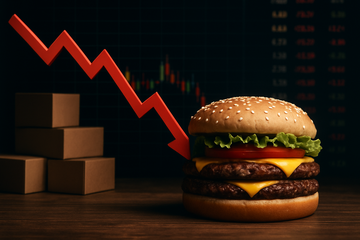
The September 23 Inflection: A CEO Warning the Street Didn't Want to Hear
McDonald's closed at $236.50 on September 25, 2026, capping the worst stretch for the stock since October 2022. Shares fell roughly 5% on September 23 after the company's Investor Day in Chicago, when CEO Chris Kempczinski delivered the line investors had been dreading: industry customer traffic in key markets will be flat while inflation continues to accelerate. The stock is now down about 31% from its March 2026 high of $341.75 and roughly 30% year-to-date, with a market cap of $167.36B and a trailing P/E of 18.89 — 17.7% below its 10-year average of 22.95.
The Street went into the day positioned for the $8.5B franchisee support package to be the story; instead, the CEO's macro call ran alongside the package. With both covered, the next question is no longer how McDonald's is sizing its franchisee check — it's whether the QSR pricing-power assumption embedded in the broader peer set still holds.
What0.8% U.S. Comps Actually Means: Traffic Fell, Check Carried the Print
Q2 2026 U.S. comparable sales
+0.8%
vs. +2.5% in Q2 2025; reported Aug 4, 2026
Q2 2026 global comparable sales
+1.3%
vs. consensus of +1.4%; reported Aug 4, 2026
Q2 2026 adjusted diluted EPS
$3.38
vs. consensus of $3.32; +6% YoY
Q2 2026 consolidated revenue
$7.10B
vs. consensus of $7.13B; +4% reported, +2% constant currency
Share of traffic underperformance from value issues
~two-thirds
per CFO Ian Borden, Q2 2026 earnings call
McDonald's U.S. comp of 0.8% was a 170-basis-point deceleration from the prior-year quarter and confirmed what franchisees had been saying for two quarters: traffic is negative, and the offset from average check is narrower every period. CEO Kempczinski framed the cause as execution — too many menu deployments, longer ticket times, inconsistent value-tier rollout — but CFO Ian Borden was blunt on the earnings call: value-tier execution accounted for roughly two-thirds of the traffic underperformance.
The NEXT Plan: $8.5B to Franchisees, 50K Restaurants Pushed to 2028, Margins Re-Set Higher
| Target | Level / commitment | Reference point |
|---|---|---|
| Franchisee support commitment | $8.5B through 2036 (~$5B by 2030) | First multi-year franchisee aid of this scale |
| U.S. restaurant efficiency uplift | ~250 bps at restaurant level | ≈$100K annual cash flow per average U.S. store |
| Payback window | ~4 years for franchisees | After factoring in support |
| Operating margin (2030 target) | Low-to-mid 50% range | vs. 46.1% in FY 2025 (10-K) |
| Incremental capex (2027–2030) | $1.5B–$2.0B for NEXT | On top of ~$3B annual base capex (2025: $3.4B) |
| G&A as % of systemwide sales (2030) | ~1.9% | vs. 2.2% forecast for 2026 |
| Restaurant count target (global) | 50,000 by 2028 | Delayed one year from prior 2027 target |
| Market-share gain by 2030 (chicken) | +1.5 percentage points | Global chicken category |
| Market-share gain by 2030 (beverages) | +1.5 percentage points | Global beverage category |
| Sales contribution from unit growth (2027 / 2030) | ~2.5% / ~2.0% | Of systemwide sales growth |
The plan does three things. It shifts roughly $5B of restaurant-level cost onto McDonald's corporate over five years via rent relief and direct capital contributions, raising the company's capex envelope by 8–11% above the $3B annual base. It targets a400–500 bp operating-margin expansion to the low-to-mid 50% range by 2030, a level the chain has never sustained for more than a couple of years. And it pushes out the global 50,000-restaurant milestone by a full year to 2028, citing cautious consumer spending and higher cumulative construction-cost inflation.
- The $8.5B commitment is essentially a 10-year capital transfer to operators — it offsets inflation pressure at the store level but absorbs it onto the corporate income statement.
- The 'Make It Golden' multiyear training program (rolling out October 5) and the AI-driven 'ArchIQ' operating system are the execution bets that determine whether 250 bps of restaurant efficiency actually materializes.
- The 50,000-store delay to 2028 is the part of the plan the market read as the most candid admission that traffic is the binding constraint.
- The chicken and beverages +1.5pp market-share targets point directly at Wendy's, Burger King, and Taco Bell — categories where McDonald's has historically been under-indexed.
Industry Reality: QSR Traffic Has Gone Negative and Stayed There
U.S. QSR traffic has dropped for two consecutive years
Year-over-year change in U.S. quick-service restaurant traffic by quarter
Unit: % YoY
Q2 2025
First sustained decline
-1.1
Q2 2026
Bottom shows no recovery
-1.2
May 2026 (monthly)
Gas-price spike month
-4.4
The macro frame Kempczinski laid out is not a forecast — it is a description of what already happened. U.S. QSR traffic was down 1.2% in Q2 2026 versus down 1.1% in Q2 2025. Fast-food visits fell 2.3% in Q2, with chains like Wendy's, IHOP, Denny's, and Sweetgreen reporting softer foot traffic. The most telling industry metric: the share of QSR stores suffering a 'traffic-driven decline' (guest count falling even when prices are flat or modestly raised) climbed to 36.3% in Q2 2026, up from 27.8% a year earlier.
The Peer-Set Stress Test: Who Can Run a No-Traffic-Growth World?
| Company | U.S. comp / traffic | Latest quarter | Q2 comparable metric |
|---|---|---|---|
| McDonald's | U.S. traffic declined; check offset | Q2 2026 | +0.8% U.S. comp / +1.3% global |
| Wendy's | U.S. traffic -12.5%; check +5.6% | Q2 2026 | U.S. same-restaurant sales -7.0% |
| Chipotle | Transactions +1.0%; check +1.2% | Q2 2026 | Comparable restaurant sales +2.2% |
| Yum Brands — Taco Bell U.S. | 7% same-store sales growth | Q2 2026 | System sales +9%; restaurant margin 26.2% |
| Yum Brands — KFC | KFC global same-store sales +2% | Q2 2026 | KFC unit growth +7% |
| Restaurant Brands Intl. — Burger King U.S. | Turnaround momentum | Q2 2026 | BK U.S. comparable sales +8.5% |
| Restaurant Brands Intl. — Tim Hortons Canada | Flat domestic comp | Q2 2026 | Canada comp +0.1% |
Wendy's is the cleanest read on what the consumer side looks like: U.S. same-restaurant sales fell 7.0% on a 12.5% traffic decline partially offset by 5.6% check growth. Management withdrew full-year guidance and cut the quarterly dividend from 14¢ to 7¢. This is a textbook example of what happens when check growth runs out of room before traffic stabilizes — operating leverage works in reverse.
Chipotle is the other extreme. Q2 2026 comparable restaurant sales rose 2.2%, with transactions +1.0% and average check +1.2% — the rare split where real traffic growth and modest pricing both contributed. Restaurant-level operating margin was 25.2% (down from 27.4%), still well above the QSR average. The company raised full-year comp guidance, even as the stock trades well below its 2024 peak.
Yum Brands is two stories in one: Taco Bell U.S. same-store sales rose 7% with restaurant margin of 26.2% — pricing power still working in the category. KFC global same-store sales rose only 2% with KFC unit growth at 7%, so the model depends on unit openings more than comps. Restaurant Brands International is being carried by Burger King's U.S. turnaround (comps +8.5%), while Tim Hortons Canada posted a +0.1% comp and Popeyes was the weakest performer in the portfolio.
- Wendy's traffic of -12.5% is the canary — when check growth can no longer offset the decline, operating leverage works in reverse and dividends get cut (the company halved its payout in Q2).
- Chipotle is the only major U.S. QSR name posting positive real-traffic comps right now — +1.0% transactions in Q2 — which is why it raised full-year guidance while McDonald's lowered its growth posture.
- Yum Brands' two-track model (Taco Bell pricing power, KFC unit-growth) means QSR pricing-power questions get a different answer at each concept within the same holding company.
- Restaurant Brands International is winning on the strength of Burger King's Royal Reset remodel program — a counter-example that traffic can be engineered back with capital and operational focus.
Valuation: McDonald's Is Already at a Discount, but Discounts Without Earnings Revisions Don't Stick
| Metric | Current | Reference | Implied gap |
|---|---|---|---|
| Stock price | $236.50 | 52-week range $234.03–$341.75 | Off 30.8% from 52-week high |
| Market cap | $167.36B | Shares out: 707.64M | — |
| Trailing P/E | 18.89 | 10-year average: 22.95 | 17.7% below 10-year avg |
| Trailing P/E | 19.47 | 10-year median: 25.85 | 24.7% below 10-year median |
| Forward P/E | 19.9 | — | — |
| Price/Sales | 6.09 | — | — |
On multiples alone, McDonald's screens as a value stock within its own history — 18.89 trailing P/E against a 10-year average of 22.95, and a 10-year median of 25.85. The discount is roughly 18–25% versus its own history. But multiple compression of this scale only holds if earnings converge to street expectations, and Kempczinski's flat-traffic-plus-rising-inflation frame is exactly the input that triggers downward revisions.
What to Watch: Short-Term Catalysts vs. the Structural Reset
Near-term (days–quarters): the next real test is Q3 2026 U.S. comps, expected late October. The McValue execution reset, plus the removal of digital BOGO promotions, should show up as either a traffic stabilization or a continuation of the 0.8% Q2 pattern. Oppenheimer cut its price target on September 25 to $295 from $325 — a clear signal sell-side models are still being marked down.
Long-term (1–3 years): the $8.5B NEXT spend, the AI-driven ArchIQ rollout to U.S. drive-thrus, and the 250 bps of restaurant-level efficiency all have to land before the 2030 margin target becomes credible. Until then, the U.S. consumer is the binding constraint, not the franchisee P&L.
Synthesis: Pricing Power Is Now a Per-Name Question, Not a Sector Question
Kempczinski's flat-traffic-plus-rising-inflation frame is the structural answer to the question QSR investors have been asking all year: is the consumer broken, or just stretched? The answer is the latter, with no relief visible. Big-Mac pricing power — the trade that worked for 2023–2024 — has stopped working not because McDonald's priced too aggressively, but because the lower-income core customer that drives the largest share of QSR traffic is now actively substituting away (37% of consumers say they are visiting fast-casual restaurants less, while 36% are going to grocery stores more).
The peer set tells the investor where the operating model survives that substitution. Wendy's shows what happens when check growth runs out of road before traffic stabilizes. Chipotle shows that a slightly higher price point with real food differentiation still draws transactions. Yum Brands' Taco Bell still has pricing power inside its portfolio. Restaurant Brands International shows that Burger King's reset is generating comps, but Popeyes and Tim Hortons are not. McDonald's itself is the slowest-moving name because of its scale: it can fix franchisee economics with $8.5B, but it cannot fix the U.S. consumer.
Investable read-throughs from the McDonald's reset
- Q3 2026 U.S. comps (late October) are the next catalyst; Oppenheimer cut its target to $295 from $325 on Sep 25, signaling further EPS revisions ahead.
- NEXT adds $1.5–2B to2027–2030 capex on top of a $3B annual base, while the low-to-mid 50% operating-margin target by 2030 implies 400–500 bps of expansion from FY 2025's 46.1%.
- Trailing P/E of 18.89 is 17.7% below the 10-year average, but the discount will hold only if 2027–2028 EPS estimates are not revised lower.
- Q2 2026 comparable restaurant sales of +2.2% split between +1.0% transactions and +1.2% check — the only major QSR name posting positive real traffic right now.
- Restaurant-level operating margin held at 25.2% even with the deceleration in QSR peers, and the company raised full-year comp guidance.
- If QSR traffic-driven decline at 36.3% forces peers into a value reset, Chipotle's slightly higher price point with food differentiation becomes structurally advantaged.
- Taco Bell U.S. same-store sales +7% in Q2 2026 with restaurant margin of 26.2% — pricing power still working in this category.
- KFC global same-store sales of +2% with 7% unit growth means the concept depends on openings more than comps; Pizza Hut remains the weak link.
- Two-track model means QSR pricing-power questions get a different answer at each brand within the same holding company.
- Burger King U.S. comps +8.5% in Q2 2026, the standout turnaround in the peer set — Royal Reset remodels are generating traffic.
- Consolidated comparable sales of +3.8% masks a +0.1% Tim Hortons Canada comp and Popeyes as the weakest performer in the portfolio.
- Demonstrates that QSR traffic can be engineered back with capital and operational focus — counter-example to the broader sector slowdown.
- Q2 2026 U.S. same-restaurant sales -7.0% on -12.5% traffic, with check growth of +5.6% running out of room — operating leverage works in reverse.
- Management withdrew full-year guidance and cut the quarterly dividend from 14¢ to 7¢, signaling earnings power is being reset lower.
- The cleanest read on what 'pricing power exhausted' looks like in U.S. QSR — the canary for the broader sector if traffic does not stabilize.
- Higher-income QSR and fast-casual traffic has held up better than lower-income traffic per industry data, but discretionary spend is being pressured at all income levels.
- Watch for Q3 2026 results in late October for whether the higher-income consumer is starting to retrench like the lower-income consumer already has.
- If the consumer reset spreads up the income ladder, the QSR pricing-power divide between Chipotle / Yum Brands' Taco Bell and the rest widens further.
- Hit a 52-week low alongside McDonald's on September 17, 2026, signaling the consumer reset is hitting higher-frequency beverage chains too.
- Watch Q3 2026 traffic data — if even a 2.5% price-increase pass-through fails to lift traffic, the broader QSR pricing-power thesis collapses further.
- More levered to commodity-cost inflation (coffee, dairy) than burger peers, so margin guidance from peers like Restaurant Brands International will read into BROS pricing decisions.