%22%2F%3E%0A%20%20%3Ccircle%20cx%3D%22220%22%20cy%3D%22150%22%20r%3D%22180%22%20fill%3D%22%2322d3ee%22%20fill-opacity%3D%220.12%22%2F%3E%0A%20%20%3Ccircle%20cx%3D%221010%22%20cy%3D%22130%22%20r%3D%22220%22%20fill%3D%22%2338bdf8%22%20fill-opacity%3D%220.08%22%2F%3E%0A%20%20%3Ccircle%20cx%3D%22920%22%20cy%3D%22520%22%20r%3D%22170%22%20fill%3D%22%2322d3ee%22%20fill-opacity%3D%220.06%22%2F%3E%0A%20%20%3Cpath%20d%3D%22M140%20430h920%22%20stroke%3D%22url(%23line)%22%20stroke-width%3D%2212%22%20stroke-linecap%3D%22round%22%2F%3E%0A%20%20%3Cpath%20d%3D%22M220%20360c120-150%20260-220%20380-220s260%2070%20380%20220%22%20fill%3D%22none%22%20stroke%3D%22%2367e8f9%22%20stroke-opacity%3D%220.5%22%20stroke-width%3D%2216%22%20stroke-linecap%3D%22round%22%20stroke-linejoin%3D%22round%22%2F%3E%0A%20%20%3Cpath%20d%3D%22M300%20398h600%22%20stroke%3D%22%2394a3b8%22%20stroke-opacity%3D%220.24%22%20stroke-width%3D%228%22%20stroke-linecap%3D%22round%22%2F%3E%0A%20%20%3Ctext%20x%3D%22220%22%20y%3D%22510%22%20fill%3D%22%23e2e8f0%22%20fill-opacity%3D%220.7%22%20font-family%3D%22Arial%2C%20Helvetica%2C%20sans-serif%22%20font-size%3D%2238%22%20letter-spacing%3D%228%22%3EINSIGHTS%3C%2Ftext%3E%0A%3C%2Fsvg%3E)
What’s confirmed and what it means for the supply chain
MWAA’s Dulles overhaul is moving to a board vote—but the public disclosure doesn’t eliminate interest-rate risk
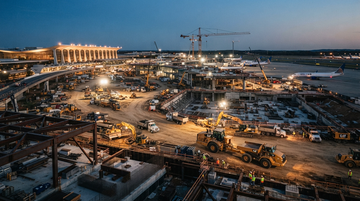
Washington Dulles International Airport’s modernization is advancing toward a key decision point: a report on MWAA’s board meeting states the board will vote on a $19.9 billion overhaul plan, positioned as a major refresh of concourses and terminal capacity. In parallel, U.S. DOT messaging around the same program describes a $20B+ capital investment and a phased rollout, explicitly linking the work to MWAA and (for parts of the scope) the airlines operating at Dulles.
The supply-chain implication is straightforward: even when projects are politically and operationally prioritized, the sequencing of design, procurement, and construction still hinges on how quickly financing pricing clears—especially when benchmark government yields sit near ~5% and municipal issuance (or credit enhancement for it) has to reprice.
Program size the public is citing
$20B+
USDOT briefing-room release on the Dulles transformation, dated Jul 29, 2026
Board-vote figure reported
$19.9B
WTVB-AM report describing MWAA board vote coverage, dated Aug 17, 2026
Financing mechanics: why “~5% yields” can matter even for public megaprojects
At ~5% 10-year yields, the bottleneck shifts from design capacity to interest-rate clearance and cash-flow timing
When a program scales to ~$20B, the interest-rate environment effectively becomes a project-planning constraint. Even if the final “all-in” capex target is disclosed, the effective cost of capital and the timing of drawdowns depend on (1) when MWAA can price/issue eligible debt, (2) whether credit spreads widen relative to earlier assumptions, and (3) how fast the project can convert design into award-ready packages.
In the U.S. airport context, MWAA’s public disclosures around the Dulles push emphasize municipal-bond financing and airline collaboration for parts of the transformation. That structure can reduce some cost-of-funds hurdles versus private-market borrowing, but it doesn’t remove market re-pricing once the program reaches the issuance window.
| Transmission channel | What changes | Why it impacts construction pace |
|---|---|---|
| Debt pricing window | Coupon/issuance cost reprices as Treasury yields move | Award schedules slip when cash timing doesn’t match procurement lead times |
| Procurement packaging | Readiness depends on guaranteed funding for each phase | Contract award bundles get resized to fit funded tranches |
| Contractor bid dynamics | Long-lead costs embed financing and risk premia | Fewer bids clear economically if uncertainty rises |
Impact mapping: upstream engineering + construction vs. materials durability
The highest-probability beneficiaries aren’t just “construction”—they’re the firms with balance-sheet resilience to delayed procurement
A Dulles overhaul touches multiple layers: aerospace/airport systems (airside logistics), civil works (concourse expansions and landside upgrades), building envelopes and finishes, and industrial equipment that survives decades of operational wear. But financing-rate stress tends to express itself most clearly in lump-sum timing: when projects are phased, contractors that can carry overhead and engineering costs while waiting on tranche funding are favored.
That is why, in practice, the investor lens should split into two groups: (a) firms exposed to execution volume and project-management fees, and (b) upstream materials and heavy equipment suppliers whose demand depends on the volume of awarded packages—not merely the headline program size.
- If MWAA reprices debt costs higher, phase windows likely compress and later-stage packages get deferred, which shifts cash-flow risk onto contractors’ balance sheets.
- If procurement is delayed, heavy-equipment and structural materials orders can fall short of “expected” activity even as public press coverage stays steady.
- If scope is re-bundled into fewer, larger tranches, engineering services can see more front-loaded design work but less near-term billings.
Company-level fundamentals: using listed peers to gauge what “financing risk” does to margins
Peer fundamentals suggest how rate-driven delays show up in operating performance
Because MWAA and the Dulles master plan are not public operating companies with GAAP financial statements, the practical way to translate financing stress into an equity framework is to look at how listed execution and engineering peers behave: whether margins and free cash flow are robust enough to withstand delayed billings.
For example, Caterpillar reports FY2025 revenue of $67.6B and FY2025 net income of $8.9B, with an FY2025 gross margin profile implied by reported revenue and cost-of-revenue (from its income statement). That kind of scale and profitability can absorb temporary project timing changes better than smaller or more levered construction/EPC models.
On the other hand, Fluor shows FY2025 revenue of about $15.5B but a negative net income figure in the latest annual period available in the dataset, consistent with a business model where project risk and execution timing can materially impact earnings.
Caterpillar FY2025 net income
$8.9B
FY2025 income statement, reported Feb 13, 2026
Caterpillar FY2025 revenue
$67.6B
FY2025 income statement, reported Feb 13, 2026
Fluor FY2025 net income
-$0.05B
FY2025 income statement, reported Feb 17, 2026
Fluor FY2025 revenue
$15.5B
FY2025 income statement, reported Feb 17, 2026
United FY2025 revenue
$59.1B
FY2025 income statement, reported Feb 12, 2026
Short-term vs. long-term horizons: what to watch next
Near-term catalysts are issuance and tranche timing; long-term outcomes depend on how well phasing preserves capacity and passenger flow
- Days-to-weeks: MWAA board approval can move from “concept” to contract packaging, which typically increases short-cycle engineering and early procurement activity.
- Quarters: debt issuance/pricing and funding tranching determine which construction packages get awarded; higher yields mean fewer tranches clear at once.
- 1–3 years: if concourse upgrades protect passenger throughput and reduce congestion, airline partners can better sustain load factors, which supports sustained airport-linked demand for ground and facilities services.
Synthesis: one investable thesis you can trade
The program’s scale is already known—investors should price the schedule risk created by rate-sensitive financing windows
The Dulles overhaul is large enough that it will attract engineering and industrial execution attention. But the more decision-relevant question is not “how big is the build”—it’s whether financing cost and issuance timing preserve the original phase plan.
If municipal/credit pricing clears quickly, the market can get a clean “construction ramp” interpretation. If it doesn’t, the build still happens, but the investment path becomes more uneven: early work proceeds, later awards compress, and the cash-flow profile of contractors and subcontractors diverges.
Listed equities most exposed to the Dulles overhaul through execution, equipment, and airline demand
- Large-scale construction programs can translate into sustained heavy equipment utilization, and Caterpillar’s FY2025 $8.9B net income suggests capacity to absorb timing variance (FY2025 income statement, reported Feb 13, 2026).
- If issuance delays postpone later phases, short-cycle demand can wobble—yet scale supports resilience versus thinner-margin peers (FY2025 revenue $67.6B).
- Over 1–3 years, the build’s completion schedule can anchor equipment demand into multi-year replacement and fleet planning.
- Project timing risk can hit earnings when billings trail engineering effort, and Fluor’s FY2025 net income was about -$0.05B (FY2025 income statement, reported Feb 17, 2026).
- If tranche funding arrives later, cash-flow pressure can persist even as backlog work continues—a key risk for execution-heavy EPC models.
- If tranche funding clears quickly, early-stage packages and design work can partially offset delay effects, keeping quarterly results more stable than a pure civil-contractor model.
- USDOT messaging ties parts of the transformation to airline collaboration; for United, FY2025 revenue of $59.1B provides capacity to fund/absorb airport-partner economics (FY2025 income statement, reported Feb 12, 2026).
- Higher financing costs for airport capex don’t automatically raise airline costs, but could change the pace of gate/concourse additions, creating short-term operational friction.
- Over 1–3 years, if phasing improves capacity and passenger flow, unit revenue upside is more likely to outweigh friction costs than in a drawn-out delay scenario.