%22%2F%3E%0A%20%20%3Ccircle%20cx%3D%22220%22%20cy%3D%22150%22%20r%3D%22180%22%20fill%3D%22%2322d3ee%22%20fill-opacity%3D%220.12%22%2F%3E%0A%20%20%3Ccircle%20cx%3D%221010%22%20cy%3D%22130%22%20r%3D%22220%22%20fill%3D%22%2338bdf8%22%20fill-opacity%3D%220.08%22%2F%3E%0A%20%20%3Ccircle%20cx%3D%22920%22%20cy%3D%22520%22%20r%3D%22170%22%20fill%3D%22%2322d3ee%22%20fill-opacity%3D%220.06%22%2F%3E%0A%20%20%3Cpath%20d%3D%22M140%20430h920%22%20stroke%3D%22url(%23line)%22%20stroke-width%3D%2212%22%20stroke-linecap%3D%22round%22%2F%3E%0A%20%20%3Cpath%20d%3D%22M220%20360c120-150%20260-220%20380-220s260%2070%20380%20220%22%20fill%3D%22none%22%20stroke%3D%22%2367e8f9%22%20stroke-opacity%3D%220.5%22%20stroke-width%3D%2216%22%20stroke-linecap%3D%22round%22%20stroke-linejoin%3D%22round%22%2F%3E%0A%20%20%3Cpath%20d%3D%22M300%20398h600%22%20stroke%3D%22%2394a3b8%22%20stroke-opacity%3D%220.24%22%20stroke-width%3D%228%22%20stroke-linecap%3D%22round%22%2F%3E%0A%20%20%3Ctext%20x%3D%22220%22%20y%3D%22510%22%20fill%3D%22%23e2e8f0%22%20fill-opacity%3D%220.7%22%20font-family%3D%22Arial%2C%20Helvetica%2C%20sans-serif%22%20font-size%3D%2238%22%20letter-spacing%3D%228%22%3EINSIGHTS%3C%2Ftext%3E%0A%3C%2Fsvg%3E)
Earnings → ad-tech read-through, via grocery e-commerce economics
The market is treating ad-tech as “weak”; Instacart shows a pocket where ads are still scaling with demand
The headline number isn’t just that Instacart grew faster in advertising. It’s that the advertising line grew faster than the transaction line in the same quarter—while GTV also grew—so the growth isn’t coming from buying the illusion of demand.
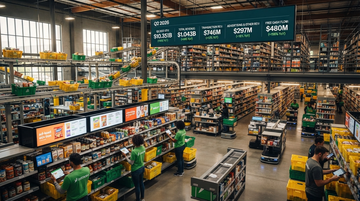
In Q2 2026 (three months ended June 30, 2026), Instacart reported $1.04B total revenue (+14% YoY) on $10.35B GTV (+14% YoY), with transaction revenue of $746M (+13% YoY) and advertising & other revenue of $297M (+16% YoY). That ordering matters for investors because it implies ads are capturing incremental value from expanding commerce activity rather than competing directly with it.
Q2 2026 GTV
$10.351B
GTV increased to $10,351M (+14% YoY), three months ended June 30, 2026 (Instacart Form 10-Q)
Q2 2026 Revenue
$1.043B
Total revenue $1,043M (+14% YoY), three months ended June 30, 2026 (Instacart Form 10-Q)
Transaction revenue growth
+13% YoY
$746M vs $659M in Q2 2025 (Instacart Form 10-Q)
Advertising & other revenue growth
+16% YoY
$297M vs $255M in Q2 2025 (Instacart Form 10-Q)
Supply-chain-aware mechanism: grocery purchase intent → on-platform targeting → measurable lift
Ads can grow faster than transactions when ad-load is measured against conversion—not clicks
Mechanically, Instacart sits between three links:
1) Upstream: consumer demand in the form of grocery “shopping occasions” (recipes, pantry replenishment, deal-driven baskets). 2) Midstream: the grocery commerce transaction on Instacart’s marketplace (orders that create first-party intent signals). 3) Downstream: brand and retailer advertising budgets seeking proof that spend drives trips and sales.
When advertising grows faster than transactions and GTV grows, it suggests advertisers are willing to place incremental budget because performance is improving with more measurable purchase context. That’s the opposite of the common ad-tech worry: that performance degrades, or that growth is funded by market-share spending rather than by real incremental conversion.
| Metric (Q2 2026) | Value | YoY growth | What it implies |
|---|---|---|---|
| GTV | $10,351M | +14% | Commerce demand is expanding. |
| Transaction revenue | $746M | +13% | Marketplace monetization rises with orders. |
| Advertising & other revenue | $297M | +16% | Advertiser budgets scale faster than transactions. |
| Ad contribution to GTV (advertising & other revenue contribution rate) | 2.9% | +0.1 pp (vs 2.8%) | Ad-load increases without breaking order growth. |
Cash flow as a reality check (growth that doesn’t evaporate)
The ad acceleration shows up in free cash flow—so it’s not just higher revenue, it’s higher cash conversion
Earnings narratives are often fragile when they rely on accounting optimism. Here, the quarter’s cash picture strengthens the case.
Instacart reported free cash flow of $480M, up from $187M in Q2 2025 (+156% YoY). The company’s FCF definition is operating cash flow less purchases of property and equipment (including capitalized internal-use software), which makes it a reasonably direct proxy for how much of the growth is funding itself rather than requiring continuous external support.
Q2 2026 Free cash flow (FCF)
$480M
FCF was $480M vs $187M prior year (+156% YoY), as reconciled in Instacart Form 10-Q
FCF definition used
Op. cash flow - capex
FCF = net cash from operating activities less purchases of property & equipment (incl. capitalized internal-use software) (Instacart Form 10-Q)
Data center / cloud linkage: ad systems need compute, but the growth is not “GPU hype”
This is an ad channel where compute supports measurement—so cloud demand is a second-order story, not the primary catalyst
Advertising performance in a marketplace setting depends on model-driven ranking, personalization, and attribution. Those functions typically map to compute demand, which is why the topic brief includes “datacenterscloud.”
But the investable takeaway here is not “more compute means more revenue.” It’s that Instacart is demonstrating measurable scaling in a category where advertisers pay for outcomes tied to shopping behavior. That matters for cloud-adjacent investors because it implies the ad budgets are tied to conversion economics rather than being purely discretionary or structurally pressured like many upper-funnel channels.
- relates ad budget growth to measured commerce demand rather than generic impressions volume.
- increases ad contribution rate to 2.9% of GTV without a visible order-growth penalty in the same quarter.
- does not disclose compute spend or model KPI details in the opened filing excerpts—so cloud linkage remains an inference from the ad-tech nature of the product.
What else you should look for next quarter
The bull case hinges on ad-load discipline and repeatable conversion metrics, not on one-quarter momentum
Short-term (next 1–2 quarters), watch for three things in the same lines Instacart already reports:
- Whether advertising & other revenue continues to grow faster than transaction revenue while GTV stays positive.
- Whether the advertising & other revenue contribution rate to GTV moves up (good) without causing a slowdown in order-driven monetization.
- Whether free cash flow stays elevated relative to the prior year rate of improvement.
Long-term (1–3 years), the key is whether the “grocery e-commerce as a real-demand ad channel” dynamic becomes a sustained budget preference—because that would change how brands allocate between marketplace search, retail media, and broader ad networks.
Investor synthesis: why grocery is structurally different
Grocery is where advertisers can buy measurable trips—and Instacart is proving the channel can expand without cannibalizing volume
Here’s the clean thesis from this quarter’s mix:
Instacart is showing a rare retail pattern where an ad line grows faster than the transaction line while the underlying commerce metric (GTV) is also up. In investor terms, that argues that advertisers are not merely replacing other spend; they are adding budget into a channel where conversion is more observable.
So while “ad-tech weakness” headlines may remain relevant for some platforms, this quarter argues that grocery e-commerce retail media is behaving more like a category growth tailwind than a cyclical contraction.
Listed stocks most plausibly linked to this ad-growth mechanism
- supports continued ad scaling because Advertising & other revenue grew +16% YoY alongside +14% YoY GTV in Q2 2026.
- improves quality of growth as free cash flow rose +156% YoY to $480M in Q2 2026.
- suggests operating leverage as ad-load increased to a 2.9% GTV contribution rate without slowing transaction revenue growth.
- faces relative headwind if brands reallocate budgets from upper-funnel ad networks into measurable retail-media placements.
- near-term stock impact depends on whether retail-media channel share continues to grow while Instacart’s ads outpace transactions (Q2 2026 evidence).
- long-term impact is uncertain because TTD’s mix can differ by customer and measurement stack—no segment data in this session.
- benefits if brands keep shifting incremental advertising toward grocery retail media where conversion is measurable.
- near-term takeaway: if the channel proves resilient in Q2, retailer ad monetization should hold up better than broader ad spend (inferred from Instacart’s reported mix).
- long-term margin impact depends on whether retailers scale sponsored placements without harming conversion economics—unverified in this session.
- watch whether retail-intent ad budgets increasingly route to on-commerce marketplaces instead of search/display auctions.
- near-term signpost would be persistent faster ad growth than transaction growth in multiple quarters at Instacart.
- long-term outcome depends on distribution: Google can still capture query intent even if sponsored retail media expands.