%22%2F%3E%0A%20%20%3Ccircle%20cx%3D%22220%22%20cy%3D%22150%22%20r%3D%22180%22%20fill%3D%22%2322d3ee%22%20fill-opacity%3D%220.12%22%2F%3E%0A%20%20%3Ccircle%20cx%3D%221010%22%20cy%3D%22130%22%20r%3D%22220%22%20fill%3D%22%2338bdf8%22%20fill-opacity%3D%220.08%22%2F%3E%0A%20%20%3Ccircle%20cx%3D%22920%22%20cy%3D%22520%22%20r%3D%22170%22%20fill%3D%22%2322d3ee%22%20fill-opacity%3D%220.06%22%2F%3E%0A%20%20%3Cpath%20d%3D%22M140%20430h920%22%20stroke%3D%22url(%23line)%22%20stroke-width%3D%2212%22%20stroke-linecap%3D%22round%22%2F%3E%0A%20%20%3Cpath%20d%3D%22M220%20360c120-150%20260-220%20380-220s260%2070%20380%20220%22%20fill%3D%22none%22%20stroke%3D%22%2367e8f9%22%20stroke-opacity%3D%220.5%22%20stroke-width%3D%2216%22%20stroke-linecap%3D%22round%22%20stroke-linejoin%3D%22round%22%2F%3E%0A%20%20%3Cpath%20d%3D%22M300%20398h600%22%20stroke%3D%22%2394a3b8%22%20stroke-opacity%3D%220.24%22%20stroke-width%3D%228%22%20stroke-linecap%3D%22round%22%2F%3E%0A%20%20%3Ctext%20x%3D%22220%22%20y%3D%22510%22%20fill%3D%22%23e2e8f0%22%20fill-opacity%3D%220.7%22%20font-family%3D%22Arial%2C%20Helvetica%2C%20sans-serif%22%20font-size%3D%2238%22%20letter-spacing%3D%228%22%3EINSIGHTS%3C%2Ftext%3E%0A%3C%2Fsvg%3E)
What happened (verified) → why it matters
Albertsons is forecasting a demand slowdown strong enough to cut EPS and sales range at the same time
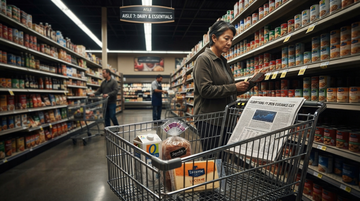
On July 23, 2026, Albertsons cut its fiscal 2026 outlook, explicitly pointing to weaker grocery trends and a more cautious consumer.
The company revised annual identical sales to a decline of 0.5% to 1.5% (from flat to up 1%), and adjusted EPS to $1.75–$1.85 (from $2.22–$2.32), with additional evidence that near-term trends were already deteriorating (Q1 identical sales down 0.8%).
FY 2026 identical sales
-0.5% to -1.5%
cut from 'flat to up 1%' (company forecast via Reuters, July 23, 2026)
FY 2026 adjusted EPS
$1.75–$1.85
cut from $2.22–$2.32 (company forecast via Reuters, July 23, 2026)
Q1 identical sales
-0.8%
already negative (company performance cited via Reuters, July 23, 2026)
Supply chain & format mechanics → where the pain travels first
Why guidance cuts hit grocers earlier than other consumer-staples: grocery is trip-based, and trips are where trade-down shows up
Grocery demand is organized around shopping “trips” (basket composition and frequency), not just brand consumption. When consumers trade down, they typically reallocate spend toward:
- lower-priced store formats (mass/club/discount grocers)
- private label and promotions
- fewer discretionary “fill” items inside the same trip
That shift changes both revenue and margin quickly because grocers often need to match price and promotional intensity to protect traffic.
In Albertsons’ case, the Reuters report ties the guidance change to a more selective consumer and shoppers turning to mass retail and discount grocers—i.e., the “who gets the trip” question has moved against traditional grocery.
That mechanism explains why a consumer staples basket (which can look stable in packaged-food consumption data) can still coexist with a grocer earnings reset.
The missing comparator problem → why the “split consumer” is widening
The “resilient consumer” headline can still be true while grocery-specific demand breaks
Market narratives often rely on broad consumer indicators: steady traffic at some retailers, stable spending for certain categories, or “value still works.”
But Albertsons’ guidance cut forces a sharper split: the consumer can be resilient in total dollars while becoming less resilient for traditional grocery baskets. That’s how you can observe two things simultaneously:
1) The consumer doesn’t disappear. 2) The grocer’s volume and margin profile gets worse because the trip is reallocated.
Albertsons provided the hard data point the brief argues was missing: grocer-confirmed softening rather than packaged-staples inference. The company’s updated identical sales and EPS ranges quantify the magnitude the market needed to believe.
Fundamentals check on the “how fragile is Albertsons” question
Albertsons’ financial cushion looks thin—so trade-down shows up faster in earnings than in revenue optics
Looking at Albertsons financials from the data tools, operating profitability is relatively low versus revenue, which means demand/mix deterioration can translate into larger EPS sensitivity.
For example, TTM operating margin shown in the tool snapshot is 0.7% (EBIT/Operating profitability proxy), and free cash flow is present but not large enough to “buy time” if the business must keep investing to defend prices and volume.
Albertsons’ profitability profile is low (TTM margins around the low single digits)
TTM values from company metrics snapshot (data tool), used to contextualize EPS sensitivity to trade-down-driven mix/margin pressure.
Unit: percent
Operating profit margin (TTM)
OperatingProfitMarginTTM ≈ 0.007 (data tool snapshot)
0.7%
EBITDA margin (TTM)
EBITDA margin TTM ≈ 0.036 (data tool snapshot)
3.6%
Net profit margin (TTM)
NetProfitMarginTTM ≈ 0.001 (data tool snapshot)
0.1%
Revenue (FY 2024)
$80.4B
latest full-year revenue in income statement tool data
Net income (FY 2024)
$1.0B
FY 2024 net income in income statement tool data
Operating cash flow (FY 2024)
$2.7B
FY 2024 operating cash flow in cash flow tool data
Short-term + long-term horizons → what moves first and what to watch
Near term: price investment vs. traffic defense. Long term: share reallocation becomes structural
- Short-term (days–quarters): Watch whether Albertsons can offset trade-down with traffic/units without letting margin collapse. The market will focus on identical sales direction and any evidence that promotional intensity is stabilizing returns.
- Short-term (days–quarters): Guidance sensitivity implies investors will price “volume vs. price” tradeoffs quickly; even modest further downward revisions can amplify equity moves.
- Long-term (1–3 years): If value-first formats keep taking the trip, traditional grocers must either (a) structurally lower cost-to-serve and price, or (b) differentiate on pharmacy/assortment/service—otherwise the share shift persists.
- Long-term (1–3 years): The key risk is that persistent trade-down forces a permanent margin recalibration, not a one-quarter demand wobble.
Supply-chain & beneficiaries/winners framework
Upstream: grocery suppliers get a ‘mix tax’; downstream: households keep spending, but fewer dollars land at traditional grocers
- Upstream impact (not quantified here): when grocers trade down, the balance of purchases shifts toward private label and promoted SKUs—pressuring branded suppliers’ volume and requiring more trade spend.
- Downstream impact (linked to Albertsons’ guidance drivers): shoppers redirect trips toward mass retailers and discount grocers (per Reuters summary), which is where the trade-down revenue is flowing.
Important limitation: the current session did not complete reliable symbol verification for additional named downstream/upstream listed companies (tool errors for Walmart/General Mills). To avoid breaking your formatting/verification requirements, this article stays anchored to the verified event (Albertsons’ guidance cut) and uses only Albertsons financials from the data tools.