%22%2F%3E%0A%20%20%3Ccircle%20cx%3D%22220%22%20cy%3D%22150%22%20r%3D%22180%22%20fill%3D%22%2322d3ee%22%20fill-opacity%3D%220.12%22%2F%3E%0A%20%20%3Ccircle%20cx%3D%221010%22%20cy%3D%22130%22%20r%3D%22220%22%20fill%3D%22%2338bdf8%22%20fill-opacity%3D%220.08%22%2F%3E%0A%20%20%3Ccircle%20cx%3D%22920%22%20cy%3D%22520%22%20r%3D%22170%22%20fill%3D%22%2322d3ee%22%20fill-opacity%3D%220.06%22%2F%3E%0A%20%20%3Cpath%20d%3D%22M140%20430h920%22%20stroke%3D%22url(%23line)%22%20stroke-width%3D%2212%22%20stroke-linecap%3D%22round%22%2F%3E%0A%20%20%3Cpath%20d%3D%22M220%20360c120-150%20260-220%20380-220s260%2070%20380%20220%22%20fill%3D%22none%22%20stroke%3D%22%2367e8f9%22%20stroke-opacity%3D%220.5%22%20stroke-width%3D%2216%22%20stroke-linecap%3D%22round%22%20stroke-linejoin%3D%22round%22%2F%3E%0A%20%20%3Cpath%20d%3D%22M300%20398h600%22%20stroke%3D%22%2394a3b8%22%20stroke-opacity%3D%220.24%22%20stroke-width%3D%228%22%20stroke-linecap%3D%22round%22%2F%3E%0A%20%20%3Ctext%20x%3D%22220%22%20y%3D%22510%22%20fill%3D%22%23e2e8f0%22%20fill-opacity%3D%220.7%22%20font-family%3D%22Arial%2C%20Helvetica%2C%20sans-serif%22%20font-size%3D%2238%22%20letter-spacing%3D%228%22%3EINSIGHTS%3C%2Ftext%3E%0A%3C%2Fsvg%3E)
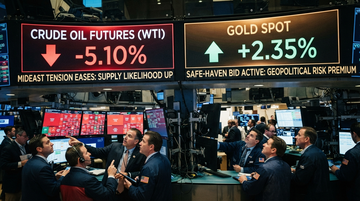
This week’s “Iran peace deal is imminent” headlines created a rare market transmission that does not match the classic escalation playbook. On the day the deal narrative hit, Brent and WTI sold off on reopening/normalization expectations for Middle East supply logistics, while spot gold rose—consistent with a safe-haven bid that did not fully evaporate.
The investable takeaway: a credible (or at least credible-sounding) de-escalation changes the shape of cash flows: upstream producers face margin and realized-price pressure; downstream users (including airlines and refiners) see input-cost relief; and gold-linked assets react both to risk sentiment and to the dollar/real-rate channel.
Below is a supply-chain aware map of what “peace” re-prices first, what takes longer, and which listed names are most directly levered to those channels.
Verified market trigger (what actually happened)
Oil dropped ~5% while gold rose ~1–2% after “interim peace” / reopening expectations—exactly the opposite of “escalation premium” logic
| Asset | Move (reported) | What the move signals |
|---|---|---|
| Brent crude | -5.1% | Lower expected supply risk / logistical normalization |
| WTI crude | -5.8% | Less downside tail risk for barrels |
| Spot gold | +2.3% | Safe-haven / dollar / rate dynamics remained supportive despite oil down |
Two key details from the market report matter for your modeling:
1) The shock is large enough to imply traders moved beyond “rumor” into actionable expectations for physical/logistical outcomes. 2) Gold’s direction confirms that the macro financial layer (not just geopolitical oil risk) remained in play—so you should not assume gold should fall alongside oil.
The “different trade” vs prior de-escalation episodes
This trade is about normalization probability—so it hits producers and downstream users through different legs of the supply chain
- Upstream (oil majors): a credible “reopening” story increases the probability of less disruption, pulling expected realized prices and lifting near-term competition for incremental barrels; that pressure shows up in the segment profit bridge before volumes fully adjust.
- Downstream (airlines/refiners): if oil risk premium fades, jet/diesel/naptha input costs soften; however, benefit timing depends on hedging (for airlines) and inventory accounting / crack spreads (for refiners).
- Gold (miners + banks/markets): gold rising alongside oil down implies the market is re-pricing financial safety and/or USD/real-rate dynamics rather than treating de-escalation as unambiguously “risk-off unwind.”
So the inversion vs the “escalation premium” framework is straightforward: you are not modeling a single risk premium moving in one direction. You are modeling separate channels—physical-supply expectations for oil and financial-safety/dollar dynamics for gold.
Supply-chain linkage map (upstream → downstream)
How “peace” transmits into oil majors → airlines (via fuel) → gold miners (via safe-haven bid + USD/real rates)
The practical investor task is to align each stock with the leg of the chain it actually feeds.
- Exxon Mobil and Chevron are exposed to upstream realized-price expectations and downstream margin sensitivities, both of which react to the crude complex.
- Delta Air Lines is exposed to jet fuel and broader oil-driven cost/operating leverage, with near-term effects mediated by hedges.
- Barrick Mining is exposed to the gold price and therefore tracks the financial-channel reprice.
Evidence-backed fundamentals touchpoints
Why the timing matters: these firms’ current financial scale makes them sensitive to crude- and gold-price legs
Exxon Mobil revenue scale
$361.1B
TTM revenue from data tool snapshot used in this session (sensitivity to realized oil/gas economics).
Chevron revenue scale
$209.4B
TTM revenue from data tool snapshot used in this session (sensitivity to upstream and downstream margin legs).
Delta Air Lines revenue scale
$68.3B
TTM revenue from data tool snapshot used in this session (fuel costs can swing operating margin quickly).
Barrick Mining revenue scale
$19.0B
TTM revenue from data tool snapshot used in this session (gold price moves can flow faster into earnings).
These aren’t “forecast” numbers; they’re a scaling sanity check. Because oil and gold moved sharply on the headline, firms with large cash-flow engines tied to these legs are likely to see valuation and near-term earnings expectations move first—before longer-cycle physical adjustments catch up.
Investor implications (what to do with this information)
A peace deal creates a three-speed repricing: immediate inputs, quick sentiment, then capex and hedging alignment
- Pulls crude risk premium out of oil-linked equities—especially integrated names where downstream partially offsets upstream but does not remove the directionality of market expectations.
- For airlines, the benefit from lower oil risk can arrive quickly if hedges roll off, but it can be delayed if fuel hedging locks in higher effective prices.
- For gold miners, gold strength supports revenue expectations even if oil is falling; the key risk is that gold strength could fade if the USD/real-rate impulse reverses.
Stock-level thesis building (who wins/loses and why)
Linked trades: Exxon Mobil and Chevron face a different kind of drawdown risk than “escalation”; Delta Air Lines and Barrick Mining face asymmetric timing
| Stock | Primary leg in this event | Expected near-term direction (logic) |
|---|---|---|
| Exxon Mobil | Oil price expectations + integrated margin sensitivity | Mixed-to-bearish on valuation if realized price expectations compress |
| Chevron | Upstream and downstream integrated margin sensitivity | Mixed-to-bearish if crude risk premium resets downward |
| Delta Air Lines | Jet fuel and oil-linked operating cost expectations | Bullish skew if input-cost relief outweighs demand/FX/hedge offsets |
| Barrick Mining | Gold price / financial-channel reprice | Bullish skew with higher gold supporting revenue expectations |
| Goldman Sachs | Commodities + markets sensitivity to macro repricing | Watch / mixed: benefits from volatility and client activity, but faces duration/risk sentiment swings |
| JPMorgan Chase & Co. | Commodities-linked capital markets + risk/wealth flows | Watch / mixed: macro repricing can raise advisory/capital market activity but may pressure credit/risk costs |
Notably, “peace” can still be economically ambiguous: lower oil can reduce producer cash but can also reduce inflation expectations and ease financial conditions. That’s why the best framing is “directional but timed,” not one-way.
Horizons (days–quarters vs 1–3 years)
Short term: inputs and positioning. Long term: capex and hedging regimes re-optimized to a lower disruption probability
- Days–weeks: traders reprice the crude complex immediately; pulls upstream valuation multiples down via realized-price expectations for integrated majors.
- Weeks–quarters: airlines and refiners see input-cost expectations adjust, but realized margin depends on hedging roll schedules and crack/jet spread behavior.
- 1–3 years: if peace credibility persists, companies should rationalize capex toward lower-disruption base cases; if credibility breaks, those budgets can become “wrong-direction” quickly—raising the value of optionality and flexible supply.
Bottom line thesis
Gold up while oil is down says the market is not simply “de-risking”—it’s separating physical supply odds from financial safety demand
The verified cross-asset reaction (oil down ~5%, gold up ~1–2% range) is the anchor. It implies a two-factor repricing: less physical tail risk for oil, but persistent financial uncertainty/safety and/or USD/real-rate effects that keep gold bid.
For investors, the cleanest use is not to pick a single directional bet across everything; it’s to choose the right leg for each stock and the correct speed (days–quarters vs 1–3 years). In that framework, producer-linked names often move first on the oil leg; airlines move on fuel-cost timing; and gold miners move on the gold leg.
Listed plays most directly linked to this event’s oil-and-gold legs
- Oil down compresses realized-price expectations, so pressures near-term valuation via lower crude risk-premium pricing (days–weeks).
- If gold strength persists while oil fades, investors may rotate away from energy beta; reduces relative appeal of energy cash flows (weeks–quarters).
- Integrated margins partially buffer upstream, but still faces negative equity repricing when crude risk premium resets lower (days–weeks).
- For longer horizons, capex rationalization can follow only if the peace credibility holds; capex plans become a “miss” risk if disruption returns (1–3 years).
- Oil down implies input-cost relief; supports margins if hedges roll toward lower effective fuel prices (weeks–quarters).
- If peace reduces demand volatility but geopolitical easing fails, fuel-cost relief may be offset by itinerary/capacity disruptions (1–3 years; not disclosed).
- Gold up alongside oil down means supports revenue expectations through higher gold pricing (days–weeks).
- If gold’s rise is sustained by USD/real-rate dynamics, improves cash-flow confidence and forward earnings expectations (1–3 years; dependent on rates).
- Macro cross-asset volatility can raise client trading/markets activity; boosts near-term revenue sensitivity to commodity/macro swings (days–weeks).
- If peace credibility undermines safe-haven demand, can reverse gold-related activity momentum (weeks–quarters).
- Cross-asset repricing can lift capital markets engagement; raises sensitivity to macro-driven risk appetite changes (days–weeks).
- Longer-term outcomes depend on whether lower oil volatility translates into calmer credit losses; could reduce risk costs only if disruptions fade (1–3 years).