%22%2F%3E%0A%20%20%3Ccircle%20cx%3D%22220%22%20cy%3D%22150%22%20r%3D%22180%22%20fill%3D%22%2322d3ee%22%20fill-opacity%3D%220.12%22%2F%3E%0A%20%20%3Ccircle%20cx%3D%221010%22%20cy%3D%22130%22%20r%3D%22220%22%20fill%3D%22%2338bdf8%22%20fill-opacity%3D%220.08%22%2F%3E%0A%20%20%3Ccircle%20cx%3D%22920%22%20cy%3D%22520%22%20r%3D%22170%22%20fill%3D%22%2322d3ee%22%20fill-opacity%3D%220.06%22%2F%3E%0A%20%20%3Cpath%20d%3D%22M140%20430h920%22%20stroke%3D%22url(%23line)%22%20stroke-width%3D%2212%22%20stroke-linecap%3D%22round%22%2F%3E%0A%20%20%3Cpath%20d%3D%22M220%20360c120-150%20260-220%20380-220s260%2070%20380%20220%22%20fill%3D%22none%22%20stroke%3D%22%2367e8f9%22%20stroke-opacity%3D%220.5%22%20stroke-width%3D%2216%22%20stroke-linecap%3D%22round%22%20stroke-linejoin%3D%22round%22%2F%3E%0A%20%20%3Cpath%20d%3D%22M300%20398h600%22%20stroke%3D%22%2394a3b8%22%20stroke-opacity%3D%220.24%22%20stroke-width%3D%228%22%20stroke-linecap%3D%22round%22%2F%3E%0A%20%20%3Ctext%20x%3D%22220%22%20y%3D%22510%22%20fill%3D%22%23e2e8f0%22%20fill-opacity%3D%220.7%22%20font-family%3D%22Arial%2C%20Helvetica%2C%20sans-serif%22%20font-size%3D%2238%22%20letter-spacing%3D%228%22%3EINSIGHTS%3C%2Ftext%3E%0A%3C%2Fsvg%3E)
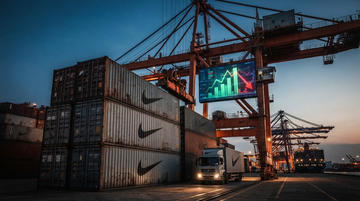
A tariff-refund headline can look like a turn in underlying operations. But in Nike’s fiscal 2026 filing, the margin uplift comes from a U.S. policy event (IEEPA tariffs) while Greater China profitability deteriorates for reasons that sound structural and inventory/promo-driven—plus management explicitly expects negative impacts to continue into fiscal 2027.
Earnings / Policy trade
The tariff refund is real—yet it largely sits on the income statement line that can mask China weakness
IEEPA tariff refund cash received (as of FY end)
$302M
Received and reflected in balance sheet timing as of May 31, 2026
IEEPA tariff receivable (as of FY end)
$684M
Outstanding recorded in “Accounts receivable, net” as of May 31, 2026
| Item | What changed in FY2026 | Why it matters for margin optics |
|---|---|---|
| Tariff refund recognition | NIKE recognized a $986M benefit in “Cost of sales” during fiscal Q4 | A cost-of-sales credit mechanically lifts gross margin in the period—regardless of demand. |
| Tariff receivable | Outstanding IEEPA tariff receivables of $684M at May 31, 2026 (plus $302M received) | This can create a near-term confidence effect, but it’s still not sales strength. |
Segment fundamentals
Greater China didn’t recover—revenue and operating income both fell, even as management blamed traffic, promotions, and marketplace inventory
| Metric (Greater China) | FY2026 | FY2025 | Change |
|---|---|---|---|
| Revenues | $5.847B | $6.586B | -$0.739B |
| Gross margin (segment implied) | 45.7% | 46.0% | -30 bps |
| Gross profit (segment gross profit) | $2.670B | $3.028B | -$0.358B |
| Operating income (EBIT) | $1.278B | $1.602B | -$0.324B |
- Management attributes the 30 bps gross margin decline primarily to unfavorable standard foreign currency exchange rate changes (not to tariffs).
- The operating income decline aligns with the narrative that demand creation and overhead dynamics weren’t enough to offset commercial pressure in Greater China.
- Most importantly, management ties ongoing performance risk to declining store traffic, elevated promotional activity, and higher levels of inventory across the marketplace.
“In Greater China, a trend of declining store traffic, elevated promotional activity and higher levels of inventory across the marketplace are negatively impacting revenues and overall profitability.”
“We expect negative impacts from Greater China … to continue throughout fiscal 2027.”
Causal mechanism
Why the margin buffer doesn’t imply a China turnaround: refunds lift reported costs, but China’s problem is sell-through and promo-inventory pressure
Think of tariff refunds as a “statement-level” tailwind. They can improve gross margin and earnings in the quarter they’re recognized, but they don’t change how quickly Nike products sell in China or how much promotional intensity is required to move inventory. In fact, Nike’s own Greater China language points to the opposite: demand softness plus elevated promos and higher marketplace inventory.
| Signal type | What the tariff refund does | What the China problem does | Investor takeaway |
|---|---|---|---|
| Accounting / P&L mechanics | Credits “Cost of sales” with a $986M benefit in FY2026 Q4 | Requires ongoing revenue generation to offset trade-down and promo pressure | Treat margin uplift as partially non-operational until proven otherwise. |
| Operating fundamentals | No direct reason it improves store traffic, sell-through, or promo-to-inventory needs | Management highlights declining store traffic, elevated promotions, and higher marketplace inventory | Forward growth and gross margin assumptions must incorporate more promo intensity risk. |
| Forward guidance language | Policy recovery is one-off/timing in nature | Management explicitly expects negative impacts to continue into fiscal 2027 | Don’t extrapolate one period’s margin improvement into a sustained China rebound. |
- If investors use the tariff-driven margin beat to assume better China sales mix (less discounting, faster sell-through), they’d be making an unsupported leap: the filing points to continued traffic/promotional/inventory headwinds.
- The most “actionable” test is whether future quarters show (a) Greater China revenue stabilization/re-acceleration and (b) relief in promo-linked indicators (which Nike flags as elevated promotional activity and marketplace inventory).
Channel mix
The Greater China decline isn’t just one channel—it shows up in both wholesale and direct to consumer revenue
| Greater China revenue line | FY2026 | FY2025 | Change |
|---|---|---|---|
| Wholesale customers | $3.255B | $3.699B | -$0.444B |
| Direct to consumer | $2.592B | $2.887B | -$0.295B |
Financial quality & what to watch next
Use inventory and cash flow as the “refund filter”: if China is still clearing via promotions, cash conversion won’t look clean
| Metric (consolidated) | FY2026 (TTM / as of May 31, 2026) | What it can indicate |
|---|---|---|
| Inventory (balance sheet) | $7.501B | Inventory level alone isn’t a smoking gun, but it’s the input to clearance/promo dynamics. |
| Accounts receivable, net (context) | $5.931B | Includes IEEPA tariff receivables timing effects; separate policy timing from operational receivables via disclosures. |
| Change in working capital (operating cash flow bridge, TTM) | -$1.991B | Working-capital drag can be consistent with clearance dynamics, though the filing-level drivers must be read quarter by quarter. |
- For this thesis, the key is not “inventory is up/down today”—it’s whether Greater China revenue starts to stabilize while promotional activity decreases (management’s stated headwind).
- Since the tariff refund is one-off/timing, future periods without similar policy credits should test whether gross margin holds up without relying on cost-of-sales benefits.
Supply-chain / policy spillover (named entities)
Tariff refunds can temporarily help retailers/manufacturers’ P&L, but if China demand needs promotions, the real pain shifts to channel inventory and markdown economics
- Upstream (material + logistics): If tariff policy is the driver of a cost-of-sales credit, upstream manufacturers’ realized margins may not improve in the same quarter as reported retail gross margin.
- Midstream (brands + distributors): Greater China’s described marketplace inventory suggests pressure can propagate into reseller/wholesale partners’ need for clearance—reducing their willingness to reorder at full price.
- Downstream (retailers and department/athletic channels): Elevated promotions in China usually correlate with consumers seeing frequent price signals; that can compress future full-price sell-through until inventory is absorbed.
Investor stance
Forward assumptions should separate “margin buffer” from “China demand truth”—because management expects the China headwind to persist into fiscal 2027
- Base case for investors: don’t model a durable China rebound from a one-time cost-of-sales reimbursement; model it as timing until Greater China revenue and operating income stop declining.
- If you see gross margin improvement without a matching Greater China revenue stabilization, treat it as potentially policy/accounting or mix-related—not demand-led.
- Primary watch item for the next 2–3 quarters: whether Nike’s reported Greater China sales trend improves while promo/inventory language weakens (or reverses).
| Evidence category | What you’d need to see | Why it would matter |
|---|---|---|
| Greater China revenue | Stabilization or re-acceleration vs FY2026 declines ($6.586B → $5.847B) | A genuine demand turn should show up first in top-line, not just cost-of-sales credits. |
| Greater China profitability | Operating income improvement vs $1.278B (FY2026) after tariff refund effects fade | If profitability rises sustainably, it points to sell-through and less clearance. |
| Commercial headwinds | Less explicit acknowledgment of declining store traffic / elevated promotions / high marketplace inventory (or evidence they’re reversing) | Management language is the most direct “truth serum” for why revenue and margins are moving. |